A Gantt chart is used for representation of a project with a graphic picture to be completed within an absolute time. It is a broad overview of a project status, which helps us to find out the how the project will be completed within a time period.
Henry Gantt is the father of the Gantt chart.
To prepare the Gantt chart, we use the Stacked bar. Stacked bar is used to compare parts of a whole across categories and shows how parts of a whole change over time.
Where you can use Gantt chart in Excel?
Gantt chart is used for predicting the project timeline. This is a visualization tool which is used for communication about the project status and progress with your team.You use the Gantt chart for most of theactivities for example:-
1.You can use Gantt chart for your daily activities.
2.If you are constructing a house you can use this chart to analyze how much time will all the activities take.
3.If you are going for a trip, you can prepare a Gantt chart.
Let’s take an example and understand, how you can make a Gantt chart
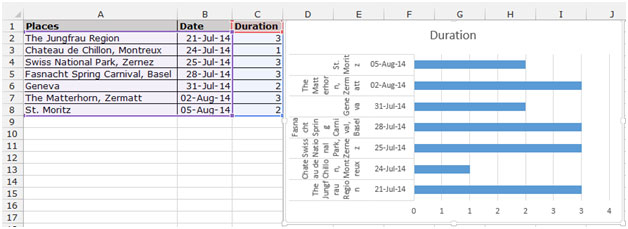
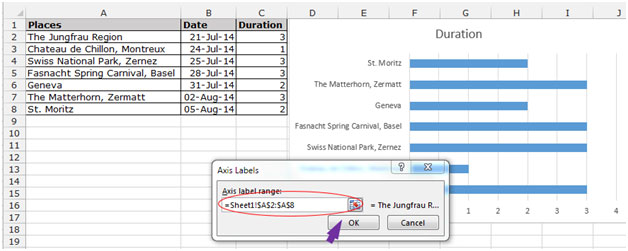
I have 15 day scheduling of Switzerland Tourist Place for the Tourist. We have data in the range A1:C8. In which Column A contains place's name, column B contains the date, and column C contains Duration.

To create the Gantt chart follow below mentioned steps:-





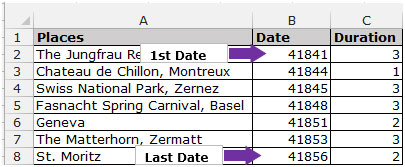
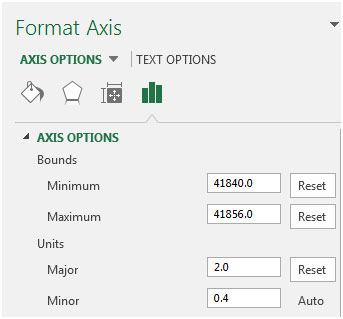
Note: - Dates and times are stored as numbers in Excel, you have to convert the date into a general number so that you would be able to define the Minimum Bounds and Maximum bounds in the Axis option.
To convert the date into the general format, select the date range B2:B8 go to the “Home” tab, in the Number group select General from the drop down list.


Note: We will write the less than number from the first date and greater than the amount from the last date so that the picture would be presentable and understanding.
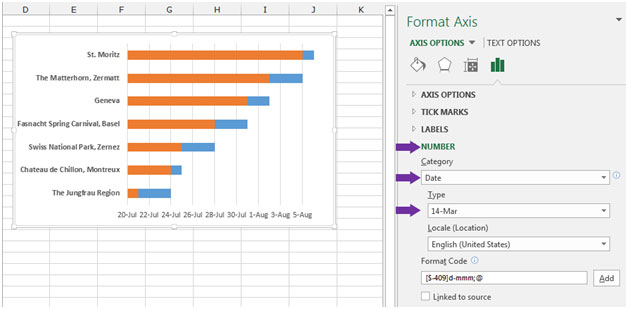
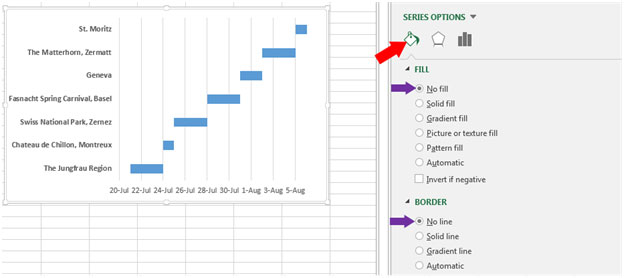
Below is the diagram of Gantt chart, when you will make your own Gantt chart that should be like this:-
Conclusion:- If you are going to present the project planning for completion then Gantt chart is the best chart.
If you liked our blogs, share it with your friends on Facebook. And also you can follow us on Twitter and Facebook.
We would love to hear from you, do let us know how we can improve, complement or innovate our work and make it better for you. Write us at info@exceltip.com
The applications/code on this site are distributed as is and without warranties or liability. In no event shall the owner of the copyrights, or the authors of the applications/code be liable for any loss of profit, any problems or any damage resulting from the use or evaluation of the applications/code.