Exponential Smoothing is used to forecast the business volume for taking appropriate decisions. This is a way of “Smoothing” out the data by eliminating much of random effects. The idea behind Exponential Smoothing is just to get a more realistic picture of the business by using the Microsoft Excel 2010 and 2013.
To access this tool, click on Data Tab, click on Data Analysis in the Analysis group. If the Data Analysis command is not available then you need to load the Analysis Toolpak.
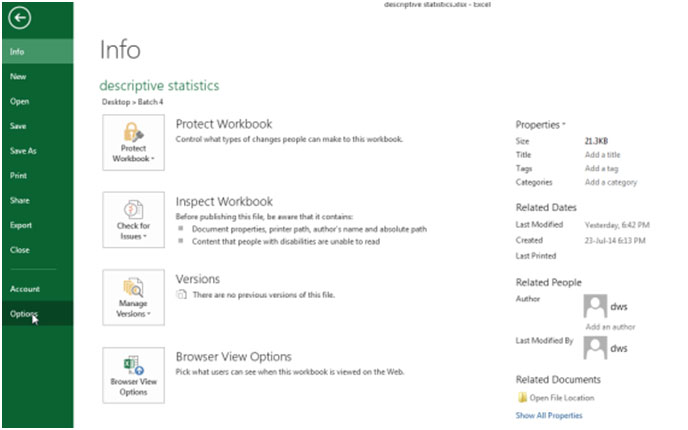
To load and activate the Analysis Toolpak follow below mentioned steps:-


Let’s come back to the topic, to prepare the forecasting of data.
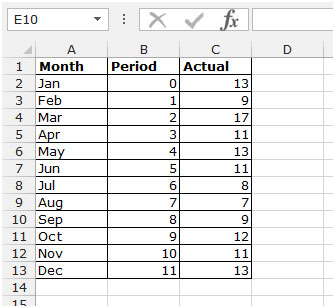
We have data in the range A1:C13, column A contains month, column B contains period, column C contains the actual values.

This example teaches you how to apply exponential smoothing to a time series in excel.
To use the Exponential Smoothing, follow the below given steps:-


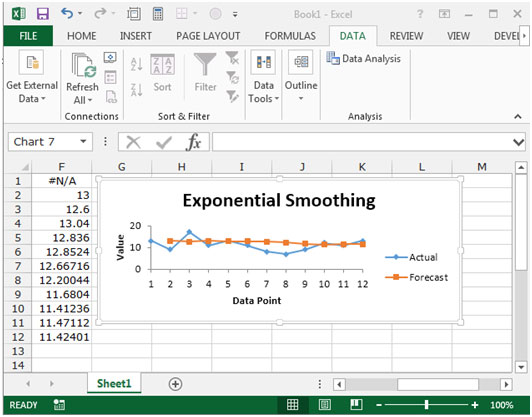
Explanation: because we set alpha to 0.1, the previous data point is given a relatively small weight while the previous smoothed value is given a large weight (i.e. 0.9).
The graph shows an increasing trend. Excel cannot calculate the smoothed value for the first data point because there is no previous data point. The smoothed value of the second data point equals the previous data point.
The applications/code on this site are distributed as is and without warranties or liability. In no event shall the owner of the copyrights, or the authors of the applications/code be liable for any loss of profit, any problems or any damage resulting from the use or evaluation of the applications/code.