About Dashboard:
Team Performance: - A company always works in teams, and every team has a different team leaders who handled the team members. Teams always work in unity, every person has different skills in different areas. If we work as team every team member should equally contribute to achieve the targets but usually some members perform very well and few members perform very low. Through analysis done through the dashboards we can see the performance of every employee in each and every area.
Basically team performance dashboard works for analyzing the team’s performance. By using the team performance dashboard we can see individual performances and make improvements in the performance on the basis of data. It will help us to forecast the next vision of targets and achievements and managing things like how we can improve sales, how we can generate revenue etc.
Dashboard Worksheets:
Dashboard Features:
Note: The Dashboard was created using a laptop with a 17-inch monitor. You might have to scroll if you view it in a smaller inch monitor.
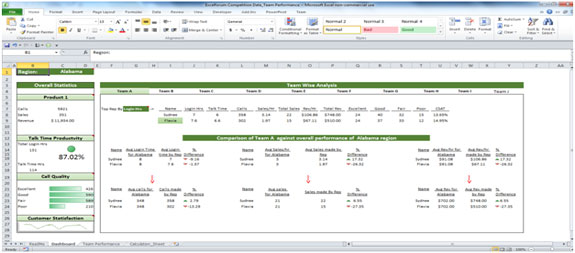
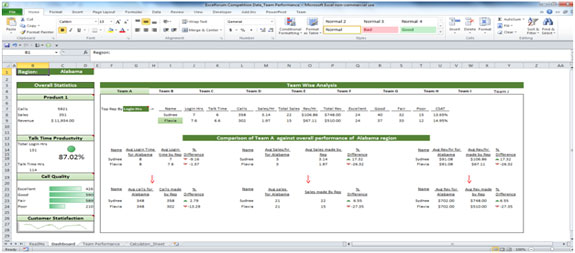
The Dashboard

Explanation of Sections
1. Region: The Region is a drop-down list that has 6 regions. User can choose any one of the regions to drill down further. These regions are got from the ‘Raw Data’.

2. Overall Statistics Secton: Once a Region is selected, the ‘Overall Statistics’ section automatically updates. This gives a high-level view of data for the region.
The table below documents what each section describes,for the region selected.

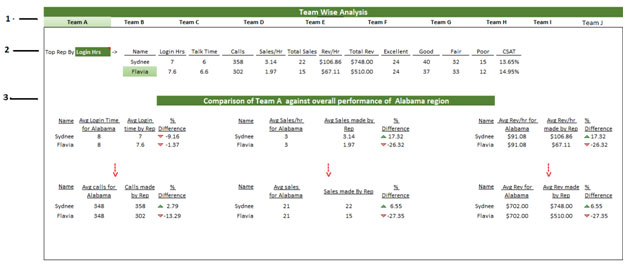
3. Team-wise Analysis: Once we have the summarized data on the left, we can look into ‘Team Wise’ data on the right.
Each region has 8 teams. Data across these teams are tabularized for easy viewing.

1 - This section lists the names of the teams. Clicking each team
a. Highlights the cell in green, to show the team selected now.
b. Changes the data in section 2 (given below)
2 – This section documents the ‘members’ of the team and their related data. Note there is an option to highlight the ‘top member’ by several criterias:
Eg: Top Rep by ‘Login Hrs’, in Team A, for ‘Alabama’ region:


Eg: Top rep by ‘Calls’, in Team A, for ‘Alabama ‘ region


3 – This section compares the team’s performance against the performance of the region as a whole.
Comparision to help ascertain the % difference based on criterias given below
a. Comparison in average login time for region vs the team members’s login time.
b. Comparison in average calls for region vs the team members’s calls.
c. Comparison in average sales/hour for region vs the team members’s sales/hour.
d. Comparison in average sales for region vs the team members’s sales.
e. Comparison in average revenue/hour for region vs the team members’s revenue/hour.
f. Comparison in average revenue for region vs the team members’s revenue.
Note: The labels update according to the region choosen.
The applications/code on this site are distributed as is and without warranties or liability. In no event shall the owner of the copyrights, or the authors of the applications/code be liable for any loss of profit, any problems or any damage resulting from the use or evaluation of the applications/code.