About Dashboard:
Sales Performance: - Every company has a product they need to sale it to increase the business and to return the expenditures of company. So sales is played very important role to increase the business and that is why we had to focus on their performance. Ultimately when sales will improve the company will grow.
Sales performance dashboard is useful to analyze the performance of sales. By using the sales performance dashboard we can see the individual performance and make improvement in the performance on the basis of data, it will help us to forecast the next vision of targets and achievement and managing the things like how we can improve the sales and how we can generate the revenue etc.
Below shown dashboard is useful to analyses sales performance in the every field.

Chart: - Sales by Region

3D PIE chart used to show the contribution of sales region wise. Through this chart we can analyze that Region 1 had high contributed in sales, and Region 3 had contributed very low comparatively other departments.
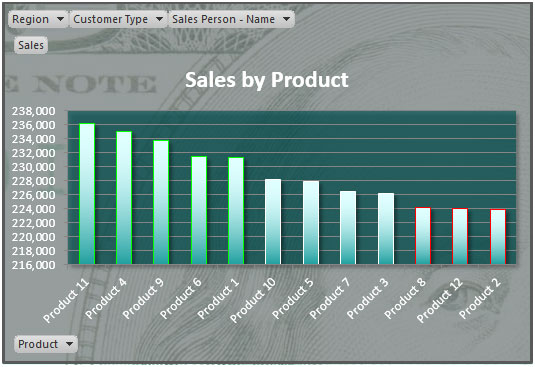
Chart: - Sales by Product

Column chart used to show the sales number product wise. Through this chart we can see top 3 sales and bottom 3 sales products wise. Product 11, 4, and 9 in the top 3 category and Product 8,12, and 2 is in the bottom category.
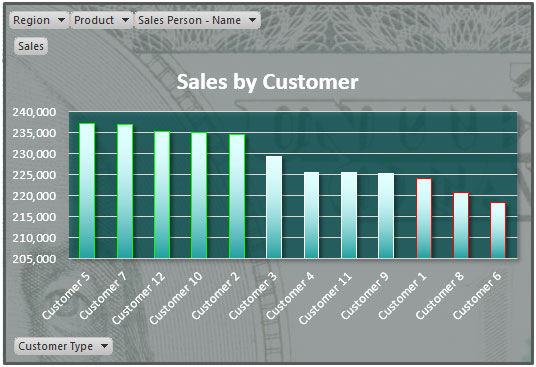
Chart: - Sales by Customer

Column chart used to show the sales number customer wise. Through this chart we can see top 3 sales and bottom 3 sales customer wise. Customer 5, 7 and 12 in the top 3 category and Customer1, 8, and 6 is in the bottom category.
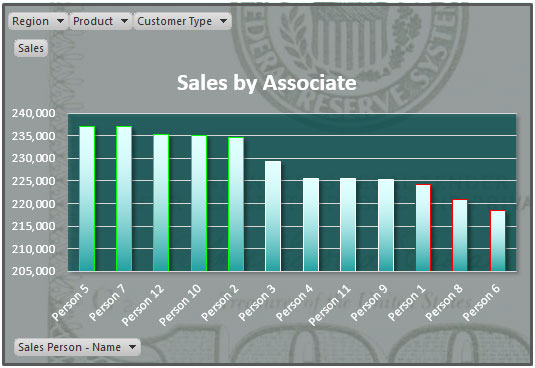
Chart: - Sales by Associate

Column chart used to show the sales number associate wise. Through this chart we can see top 3 sales and bottom 3 sales Associate wise. Sales person 5, 7 and 12 in the top 3 category and sales person 1, 8, and 6 is in the bottom 3 category.
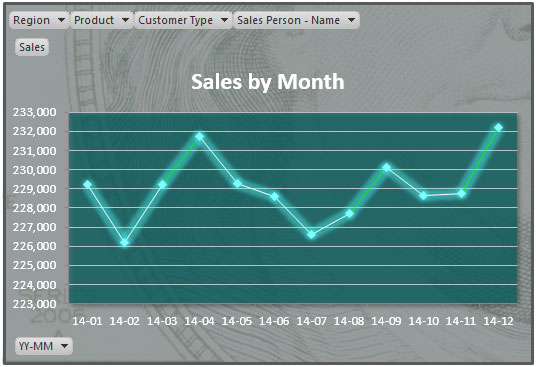
Chart: - Sales by Month

Line chart used to show the sales number month wise. Through this chart we can see top 3 sales and bottom 3 sales month wise. In the December month had very high sales and In February month had very low sales.
The applications/code on this site are distributed as is and without warranties or liability. In no event shall the owner of the copyrights, or the authors of the applications/code be liable for any loss of profit, any problems or any damage resulting from the use or evaluation of the applications/code.
To ExcelTips Management: Just Curious, why did you remove my logo? And why ignore the valuable technical tips for your readers in this offering?
Wow - so much missing from this description. The charts feature:
[*] Double click drilldown, a "Must Have" feature for Executive Dashboards. Readers can add drilldown to XL's pivot charts with my add-in available free from my blog here: https://dl.dropboxusercontent.com/u/13737137/Projects/Drilldown/Drilldown.pdf
[*] Double click Expand/Restore so small Executive Dashboard charts can be more easily read. The above add-in provides this as well.
[*] Threshold conditional formatting so key performance measures are readily identified as above or below thresholds.
[*] Near real-time updating from external data sources so this dashboard is just as useful an hour from now or tomorrow or next month as it is today. This is achieved using MS Query which comes with XL and requires no VBA. See it here: http://youtu.be/I1qvqMiGyhc
[*] The download link is missing. Readers can get it here: https://dl.dropboxusercontent.com/u/13737137/Projects/Drilldown/Drilldown.zip