
About Dashboard:
This dashboard shows Manufacturing industry.There are 10 charts & 5 tables shown.
There are initial inspection, conversion, calibration, various tests, updates & quality checking is shown.
This review is for business owner who needs an intuitive manufacturing dashboard on a daily basis, but more so needs the ability to forecast and run scenarios to grow a company.
In today’s world there is a huge pressure on the management to provide faster and transparent information which helps in determining company’s overall performance. It tracks manufacturing data which helps to see the growth from various perspective of the industry.
There are several ways in which you can visualize manufacturing data to understand the company’s goal. In October month, Excelforum teamhas launched a dashboard competing in which you are asked to visualize data using sample data. The challenge has generated a huge thrill around the community and fetched 118 incredible entries.
In this article, we will show you the steps on how to create this dashboard.
Let us see the how Dashboard made by Zodeeaklooks:
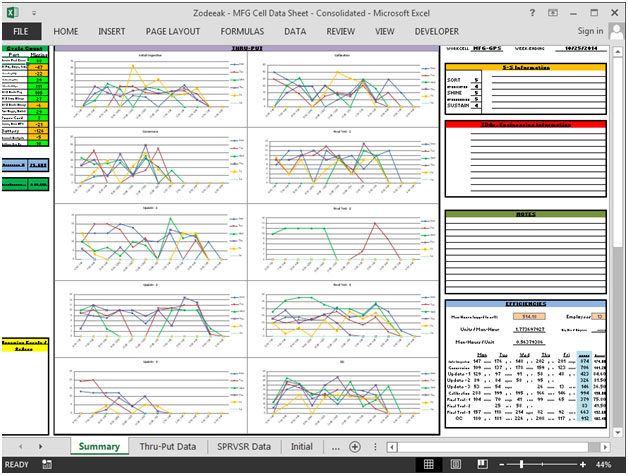
We have divided this dashboard into 6 sections of information. Let us take a look at each one separately.
Section1:
In the left section there is Cycle Count shows part name & missing numbers in the below table.
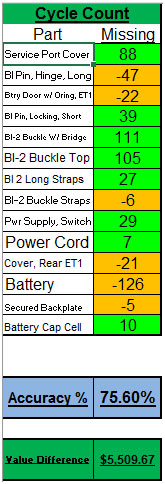
The above picture of table shows accuracy % & value difference in dollars.
Section2:
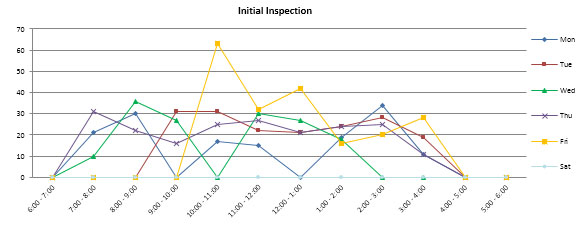
The following section shows Initial Inspection by weekdays & hourly basis using line chart.
Section3:
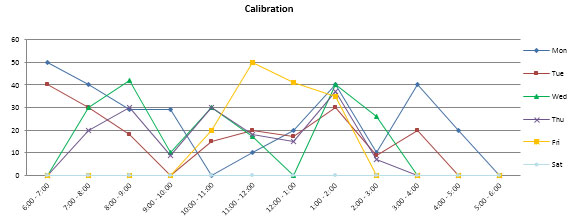
The following section shows Calibration by weekdays & hourly basis using line chart.
Section 4:
The following section shows Conversion by weekdays & hourly basis using line chart.

Section 5:
The following section shows Final test 1 by weekdays & hourly basis using line chart.

Section 6:
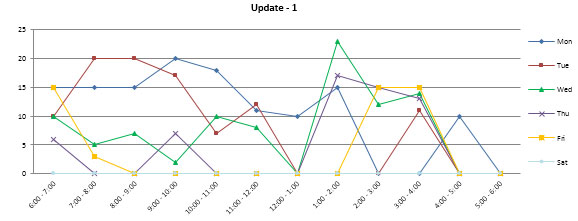
The following section shows Update 1 by weekdays & hourly basis using line chart.
Section 7:
The following section shows Final test 2 by weekdays & hourly basis using line chart.

Section 8:
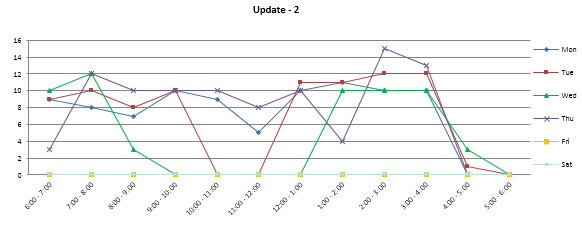
The following section shows Update 2 by weekdays & hourly basis using line chart.
Section 9:
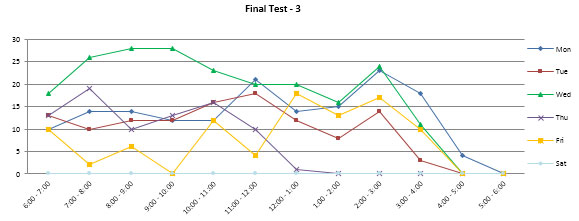
The following section shows Final test 3 by weekdays & hourly basis using line chart.
Section 10:
The following section shows Update 3 by weekdays & hourly basis using line chart.

Section 11:
The following section shows QC by weekdays & hourly basis using line chart.

Section 12:
The below is a picture of table consists of Efficiencies.
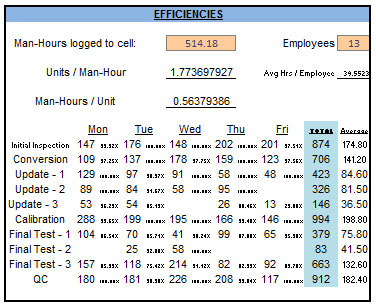
The above picture shows man hours logged to cell, number of employees, unit per man hour, average hours per employee, man hours per unit.
Using this dashboard you can get a clear view of the financialindustry and we can get the information from various point of view.
Download Dashboard
The applications/code on this site are distributed as is and without warranties or liability. In no event shall the owner of the copyrights, or the authors of the applications/code be liable for any loss of profit, any problems or any damage resulting from the use or evaluation of the applications/code.
I have download "https://www.exceltip.com/wp-content/uploads/2014/12/Zodeeak-MFG-Cell-Data-Sheet-Consolidated.xlsx" but I mis the sheet Time.xlsx is it possible to download this "Time.xlsx"?