In this article, we will learn How to print each subtotal group on a separate page in Excel.
Problem:
Page break option for each subtotal is not available on the page break option. The option hides in the subtotal option in excel. For example if you need different products subtotal on separate pages. So for this you need to know how to insert page breaks by subtotal groups.
Subtotal groups in Excel
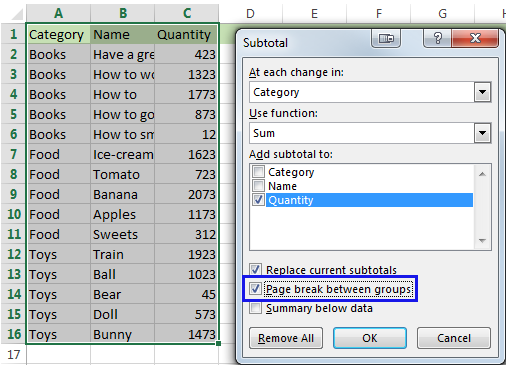
To apply subtotal Go to Data > Outline > Subtotal. Use subtotal on the data and use Page break between groups option. To understand this is in a detailed way, let's check out the below example.
Example :
All of these might be confusing to understand. Let's understand how to use the function using an example. Here we have a store date having Category, Name and quantity bought. We need to print each page for each new category.
Let's first group the data using the Subtotal option. First make sure your data is sorted ascending or descending by Category column

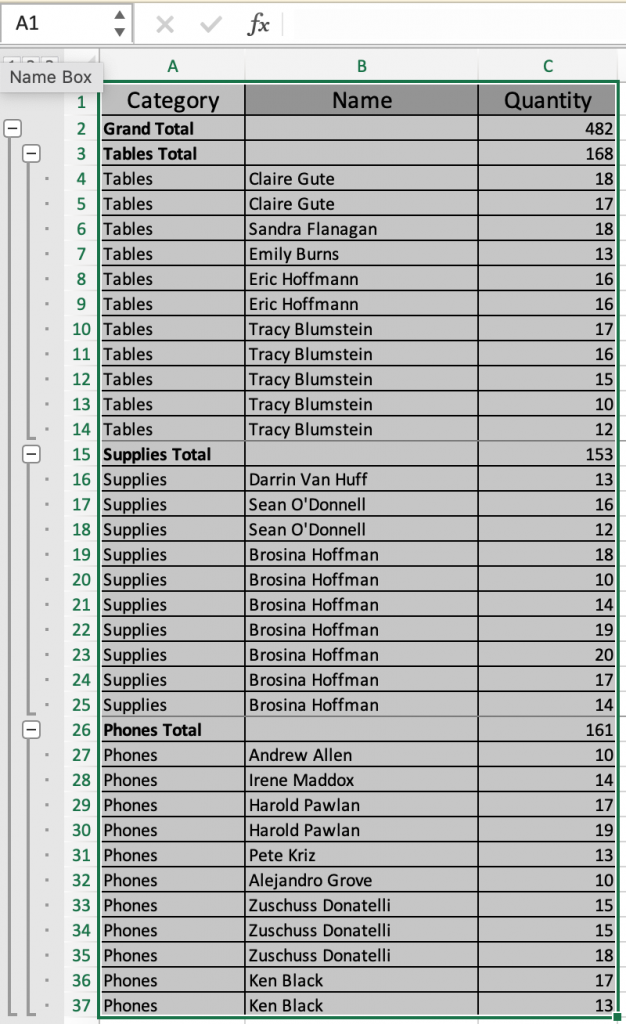
Now go to Data > Outline > Subtotal as shown below.

Subtotal dialog box will appear

Press Ok

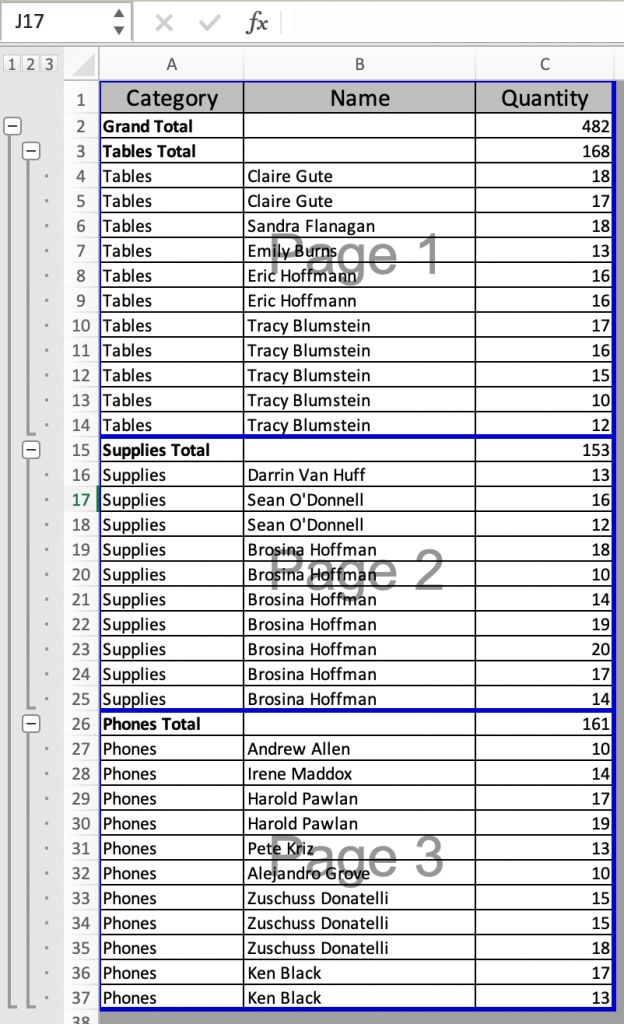
To view Page break option Go to View > Page break Preview

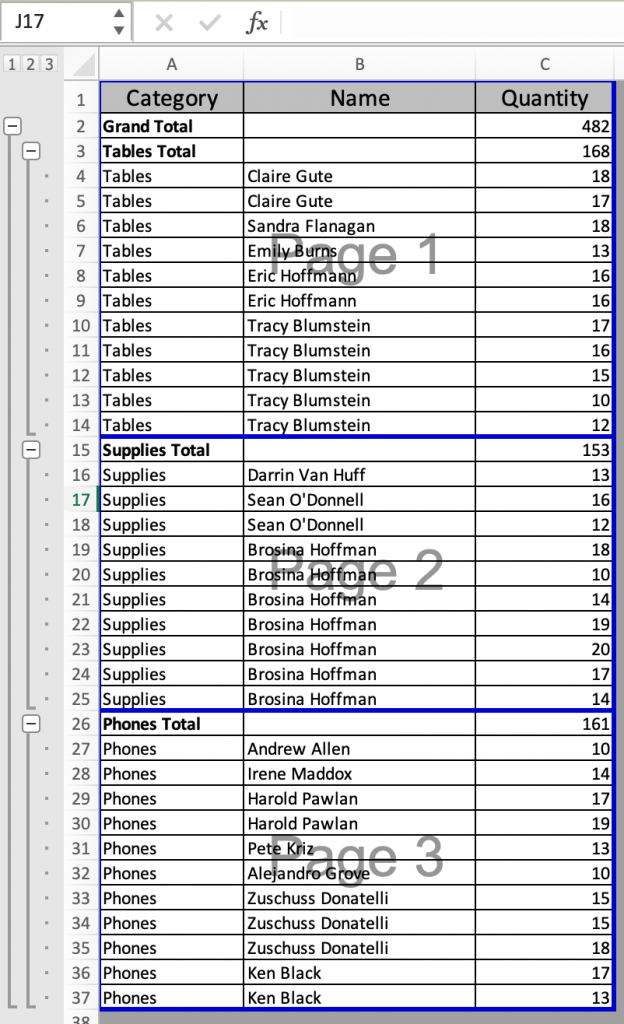
As you can see three different pages are created referred to as Page 1, Page 2 and Page 3. Now if you print. It will be printed as shown.
Remove page breaks in Excel
Just follow the below steps to remove inserted page breaks
Go to Page Layout > Breaks > Reset All Page breaks
You can go to the view option to check or the Page Layout option where the breaks option seems inactive.
Here are all the observational notes using the above method in Excel
Notes :
Hope this article about How to print each subtotal group on a separate page in Excel is explanatory. Find more articles on calculating values and related Excel formulas here. If you liked our blogs, share it with your friends on Facebook. And also you can follow us on Twitter and Facebook. We would love to hear from you, do let us know how we can improve, complement or innovate our work and make it better for you. Write to us at info@exceltip.com.
Related Articles :
How To Highlight Cells Above and Below Average Value : highlight values which are above or below the average value using the conditional formatting in Excel.
Ignore zero in the Average of numbers : calculate the average of numbers in the array ignoring zeros using AVERAGEIF function in Excel.
Calculate Weighted Average : find the average of values having different weight using SUMPRODUCT function in Excel.
Average Difference between lists : calculate the difference in average of two different lists. Learn more about how to calculate average using basic mathematical average formula.
Average numbers if not blank in Excel : extract average of values if cell is not blank in excel.
AVERAGE of top 3 scores in a list in excel : Find the average of numbers with criteria as highest 3 numbers from the list in Excel
Popular Articles :
How to use the IF Function in Excel : The IF statement in Excel checks the condition and returns a specific value if the condition is TRUE or returns another specific value if FALSE.
How to use the VLOOKUP Function in Excel : This is one of the most used and popular functions of excel that is used to lookup value from different ranges and sheets.
How to use the SUMIF Function in Excel : This is another dashboard essential function. This helps you sum up values on specific conditions.
How to use the COUNTIF Function in Excel : Count values with conditions using this amazing function. You don't need to filter your data to count specific values. Countif function is essential to prepare your dashboard.
The applications/code on this site are distributed as is and without warranties or liability. In no event shall the owner of the copyrights, or the authors of the applications/code be liable for any loss of profit, any problems or any damage resulting from the use or evaluation of the applications/code.