When we creat a chart using some data on sheet, by default the chart is created on the same sheet that can be moved using mouse. But sometimes it is better to have a standalone chart that fits on the sheet and fixed to its location. In this article, we will learn how to move chart from one sheet to new chart sheet.
Steps to move the selected chart to a new chart sheet:
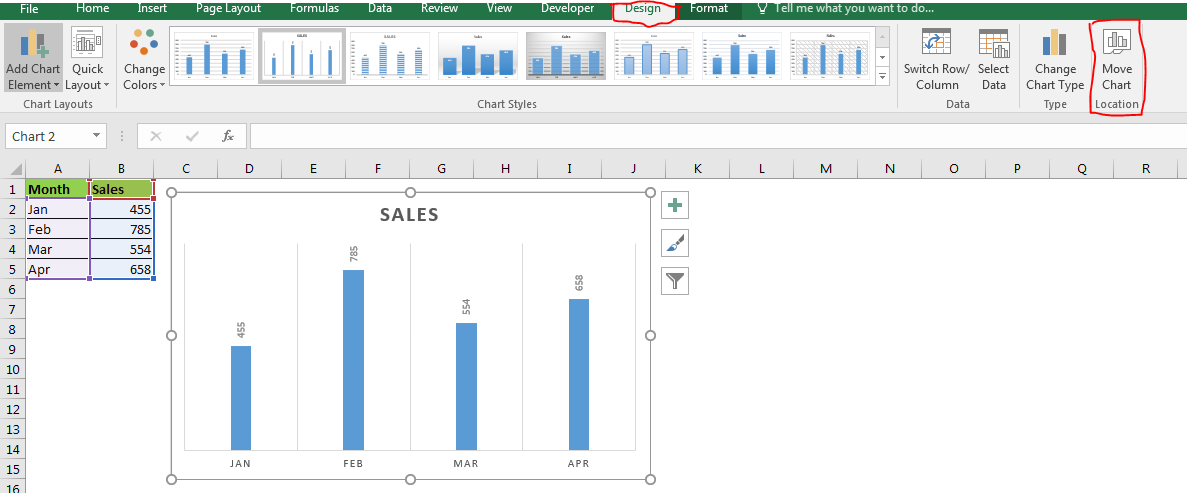
1. Select the chart and go to design tab.

2. You will see the move chart icon in right most corner of ribbon in excel 2016. Click on it.
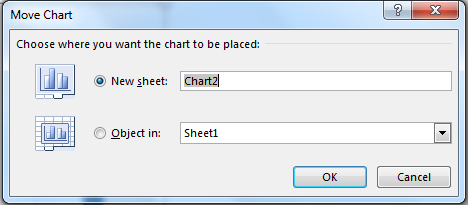
3. In move chart dialog box, click on new sheet radio button. Change the name if of chart if you like.

4. Click ok.
And its done. The chart is moved to a new chart sheet.
In a chart sheet, chart is well fitted and it is fixed but you can do all the chart related tasks. This sheet belongs to this chart. The chart is designed to fit this sheet. This make a good presentation of data.
You can move other charts too on the same sheet but other charts will float around, while the first chart will be the background of sheet.
Right click to move the selected chart to a new chart sheet
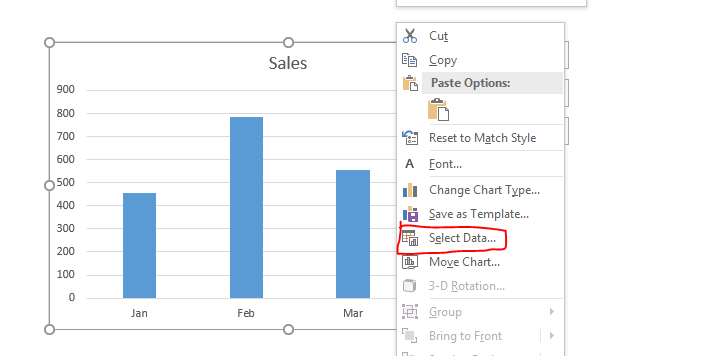
You can also move chart by right clicking on the chart. When you right click on the chart, you will see an option as move chart. Click on it. The same dialog for moving chart will open.

Move Chart From One Sheet To Another
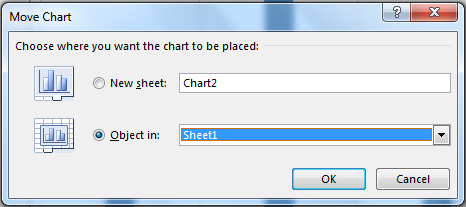
If you want to move the chart on a different normal sheet than select the object in: option.
From drop down, select the desired sheet name. Hit Ok. The chart will be moved.
The same thing can be done by normal cut-paste.
Move Chart From Chart Sheet to Normal Chart
On chart sheet, right click on the chart. Click on the move chart.
Click on object in: and select the desired sheet from drop down.

Hit ok. The chart is moved back to the normal sheet. The chart sheet will be deleted.
So yeah guys, this how you can move charts to new chart sheets to have standalone charts in excel. Let me know if you have any doubts regarding this article or any other article. Ask your excel and vba doubts in the comments section below.
Related Articles:
Excel Sparklines : The Tiny Charts in Cell
Speedometer (Gauge) Chart in Excel 2016
Creative Column Chart that Includes Totals
4 Creative Target Vs Achievement Charts in Excel
Popular Articles:
The applications/code on this site are distributed as is and without warranties or liability. In no event shall the owner of the copyrights, or the authors of the applications/code be liable for any loss of profit, any problems or any damage resulting from the use or evaluation of the applications/code.