What is Covariance?
The measuring of the relationship between the two random variables is called the covariance. As the name suggests, the covariance of the two variables tells us how the one variable varies when other variable changes. Covariance does not define the dependency of one variable on another. There are two types of covariance calculations. First is covariance of the population and the other is covariance of the sample. In this article, we will learn how to calculate the covariance of the population in excel.
The covariance value can be a negative or positive value. A negative value means that both variables move in the opposite direction. And you guessed it right, a positive covariance means that the two variables move in the same direction.
It may sound like a correlation coefficient but it is different. We will talk about it in the end.
How to find covariance of the population in Excel?
Excel provides a function COVARIANCE.P to calculate the covariance of data easily. It was introduced in Excel 2010 and since that version, it is being used widely. I am using it in Excel 2016. There is another version of this method named COVARIANCE.S. It is used to calculate the covariance of the sample data set. Another method is using analysis toolpak for calculating the covariance of the population in excel.
The syntax of COVARIANCE.P:
| =COVARIANCE.P(array1,array2) |
Array1: The values of the first variable.
Array2: The values of the second variable.
Note: These arrays can be put in any order. The length of the two arrays should be the same. If the two arrays are of two different lengths then excel will show #N/A error.
Now that we know about the covariance, let us have an example to make things even clearer.
Example: Calculate the covariance of the population in Excel
Here I have a sample data set. In range A2:A7, I have a variable X and in range B2:B7 another variable Y. Assuming that this is the data of the total population. Now let us calculate the covariances of this data and see how these two variables affect each other.
 Let's use the Excel COVARAINCE.P function:
| =COVARIANCE.P(A2:A7,B2:B7) |
This returns a value of 5.444444444.
Interpretation of Covariance
The covariance value we got is a positive value. It tells that X and Y move in the same direction. In other words, Y will increase if X increases and vice-versa. If covariance was a negative value then the opposite would be true.
How does COVARIANCE.P get calculated?
Well, the mathematical formula for calculating the covariance of the population is as below:
 Here Xi is any value in variable X where X bar is sample mean of variable X.
Yi is any value in variable Y where Y bar is the sample mean of the variable Y.
n is the number of observations.
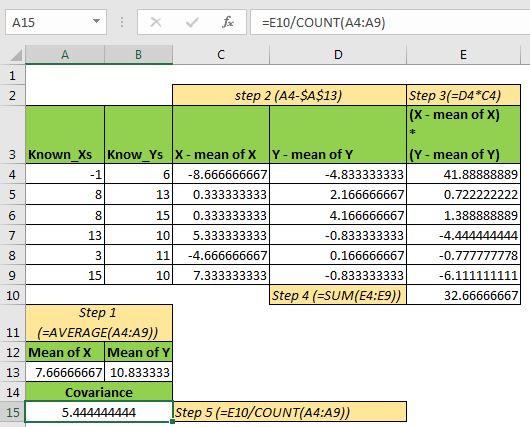
If you try to calculate the covariance of the population in excel manually, this is how you would do it.

| =AVERAGE(A4:A9) |
| =A4-$A$13 |
| =D4*C4 |
| =SUM(E4:E9) |
| =E10/COUNT(A4:A9) |
The number we get is 5.444444444 which is exactly the same as what we got from the Excel COVARIANCE.P function.
The difference in Covariance and Coefficient of Correlation
The first and major difference is the formula. The coefficient of correlation is calculated by dividing covariance by the product of the standard deviation of Xs and Ys.
The covariance tells us the direction of two random variables, whether they move in the same direction or different. It does not tell the strength of the relationship between two variables. Where correlation shows the strength of the relation between two variables in range -100% to 100%.
So yeah guys, this is how you use COVARIANCE.P in Excel. In this article, we not only learned about the COVARIANCE.P function but we also learned how we calculate it manually and how we derive it. I hope I was explanatory enough. If you have any doubts about this statical function or any other statical function of excel, then comment it in the comment section below.
Related Articles:
How to Find Correlation Coefficient in Excel
How to Use Excel NORMDIST Function
Popular Articles:
The applications/code on this site are distributed as is and without warranties or liability. In no event shall the owner of the copyrights, or the authors of the applications/code be liable for any loss of profit, any problems or any damage resulting from the use or evaluation of the applications/code.