The VAR.S or VARS function is a statistical function in excel. It is used to calculate the variance of the a sample data set. If you want to calculate variance of a entire population then use VAR.P or VARP function. They all work the same.

Variance is used to know how much a data vary from mean of data. Mathematically, variance is an average of squared mean difference. Standard deviation is squire root of Variance.
| VAR/VARS/VAR.S | VARP/VAR.P |
| =(x'-x)2/(n-1) | =(x'-x)2/n |
Syntax of VAR.S
Number1, number2,...: these are the numbers of which you want to calculate variance.
The first number is compulsory.
Notes: VAR.S ignores blank and non numeric values, including boolean values.
The first argument in is compulsory, rest are optional.
These numbers can be supplied as individual numbers, cell references, ranges or arrays to VAR.S function.
All below formulas are valid VAR.S formulas.
Example of VAR.S Function
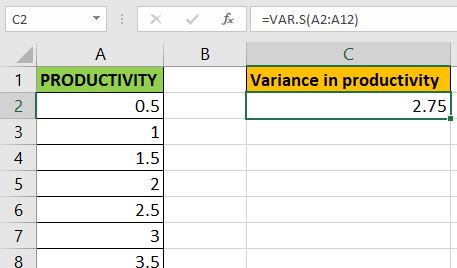
We have this data of productivity of employees in an organization. Assuming that this is the entire population, we need to calculate the variance of data.

To calculate the variance of entire population, use this VAR.S Formula.
This will return the variance in data, which 2.75. This VAR.S function reduces a lot of effort and saves time.

If we calculate the square root of this data, we will get the standard deviation, which will be about 1.7.
What is the Difference in VAR, VARS, VAR.S (all are same) and VARP or VAR.P?
The denominator in VAR, VARS,VAR.S is n-1. Where n is the number of observations. Where VAR.P has denominator n.
| VAR/VARS/VAR.S | VARP/VAR.P |
| =(x-x)2/(n-1) | =(x-x)2/n |
VAR.S is used for sample data. VAR.P is used for entire population.
This was a quick article about the VAR.S function of excel. I hope this was helpful. If you have any doubts regarding this or any other excel function, feel free to ask. I am here to answer all the queries.
Related Articles
How to use the VAR.P function in Excel : Calculate the variance for the population data in excel using the VAR.P function.
How to use the VAR function in Excel : Calculate the variance for the sample data numbers in excel using the VAR function.
How to Calculate Standard Deviation in Excel : To calculate the standard deviation we have multiple formulas. The standard deviation is simply the square root of the variance. It tells more about the data than variance.
How to use the STDEV.P function in Excel : Calculate the standard deviation for the population data numbers in excel using the VAR.P function
Regressions Analysis in Excel : Regression is an Analysis Tool, which we use for analyzing large amounts of data and making forecasts and predictions in Microsoft Excel.
How to Create Standard Deviation Graph : The standard deviation tells how much the data is clustered around the mean of the data.
Popular Articles:
50 Excel Shortcuts to Increase Your Productivity | Get faster at your task. These 50 shortcuts will make you work even faster on Excel.
The VLOOKUP Function in Excel | This is one of the most used and popular functions of excel that is used to lookup value from different ranges and sheets.
COUNTIF in Excel 2016 | Count values with conditions using this amazing function. You don't need to filter your data to count specific values. Countif function is essential to prepare your dashboard.
How to Use SUMIF Function in Excel | This is another dashboard essential function. This helps you sum up values on specific conditions.
The applications/code on this site are distributed as is and without warranties or liability. In no event shall the owner of the copyrights, or the authors of the applications/code be liable for any loss of profit, any problems or any damage resulting from the use or evaluation of the applications/code.