In a business, client/customer service plays a very important role to enhance the business. To make sure that we provide our customers or clients a high quality service we need to be available to them for 24*7 or for at least 12 hours every day via call or chat. Below is the best dashboard report for a chat process. We need to update the daily or monthly data and we can see the detailed description of the process. These dashboard have lots of tabs including Introduction, Raw Data, Report, Leads, Clicks, Sessions and CSAT %, Team Members, Login Hours, Sales, Revenue, Region and Product.
The screenshot below displays detailed description of KPIs. We have explained all the KPIs of the report in the introduction tab. KPIs contain Campaign, Team Members, Number of Visitors, Cold Leads, Hot Leads, Proactive Chats, Button Chats, Transfer Chats, Offline Clicks, Busy Clicks, Available Clicks, Button Click Rate, Proactive Chat Rate, Number of Sessions Fired, Number of times Sessions Fired, Invitations (Rule Generated), Invitations Accepted, Invitations Declined, Invitations Ignored, Excellent, Good, Fair, Poor, CSAT%

The screenshot below displays Team, Team Members, Product, Sale Date, Region, Login Hours, TTT, THT, Sales, SPH, Revenue, RPH, Calls, Excellent, Good, Fair, Poor, Total and CSAT%

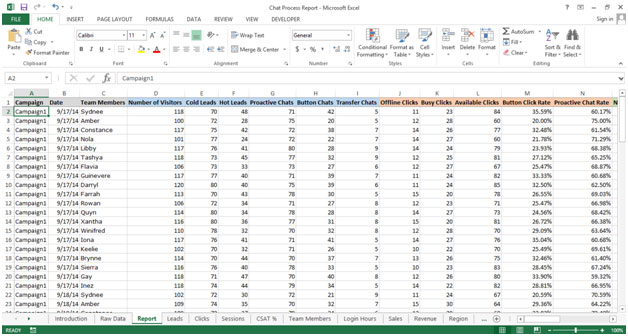
The screenshot below displays Campaign, Date, Team Members, Number of Visitors, Cold Leads, Hot Leads, Proactive Chats, Button Chats, Transfer Chats, Offline Clicks, Busy Clicks, Available Clicks, Button Click Rate, Proactive Chat Rate, Number of Sessions Fired, Number of times Sessions Fired, Invitations (Rule Generated), Invitations Accepted, Invitations Declined, Invitations Ignored, Excellent, Good, Fair, Poor, Total Surveys Received and CSAT%
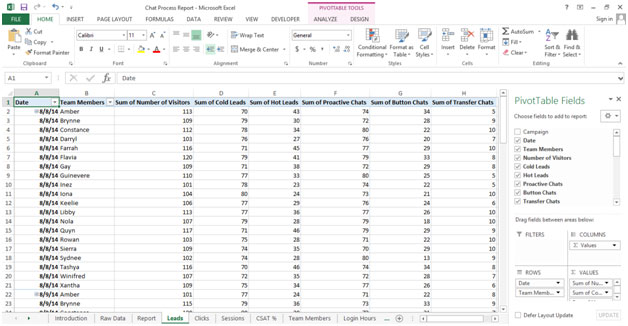
The screenshot below displays Date, Team Members, Sum of Number of Visitors, Sum of Cold Leads, Sum of Hot Leads, Sum of Proactive Chats, Sum of Button Chats and Sum of Transfer Chats
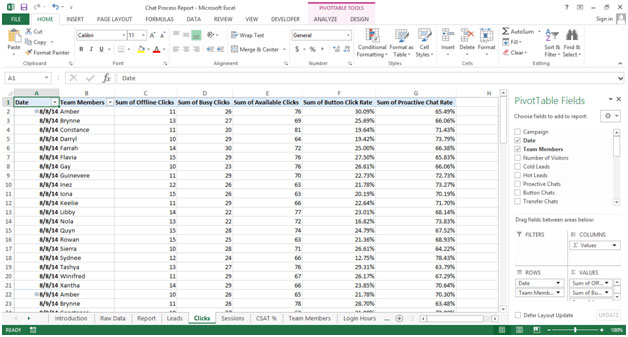
The screenshot below displays Date, Team Members, Sum of Offline Clicks, Sum of Busy Clicks, Sum of Available Clicks, Sum of Button Click Rate and Sum of Proactive Chat Rate
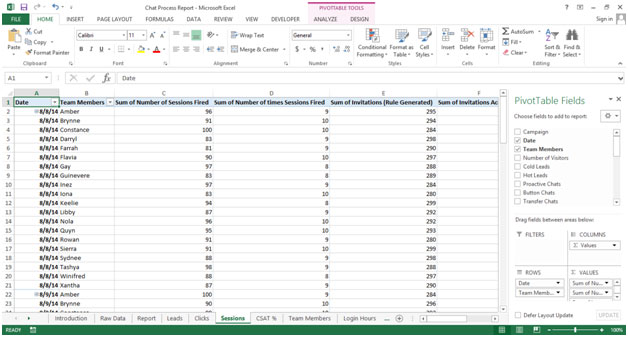
The screenshot below displays Date, Team Members, Sum of Number of Sessions Fired, Sum of Number of times Sessions Fired, Sum of Invitations (Rule Generated), Sum of Invitations Accepted, Sum of Invitations Declined and Sum of Invitations Ignored
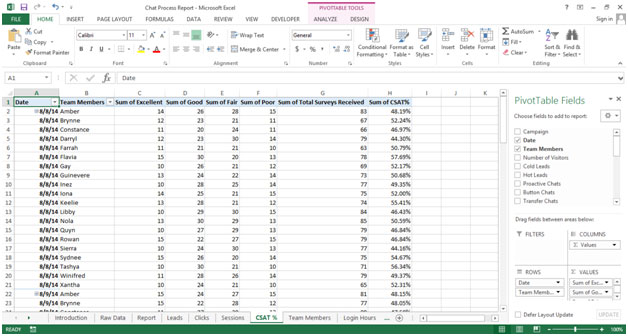
The screenshot below displays Date, Team Members, Sum of Excellent, Sum of Good, Sum of Fair, Sum of Poor, Sum of Total Surveys Received and Sum of CSAT%
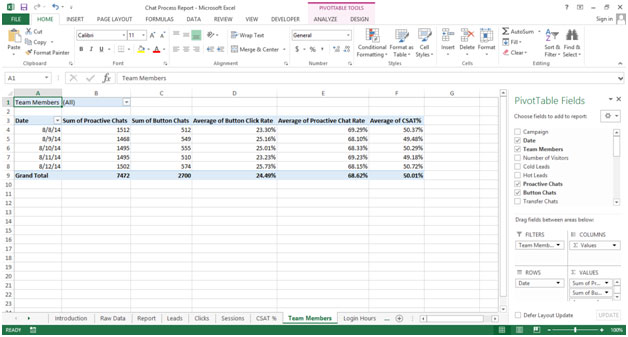
The screenshot below displays Date, Sum of Proactive Chats, Sum of Button Chats, Average of Button Click Rate, Average of Proactive Chat Rate and Average of CSAT%
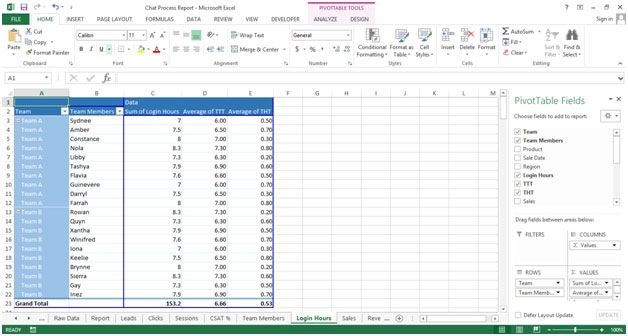
The screenshot below displays Team, Team Members, Sum of Login Hours, Average of TTT and Average of THT
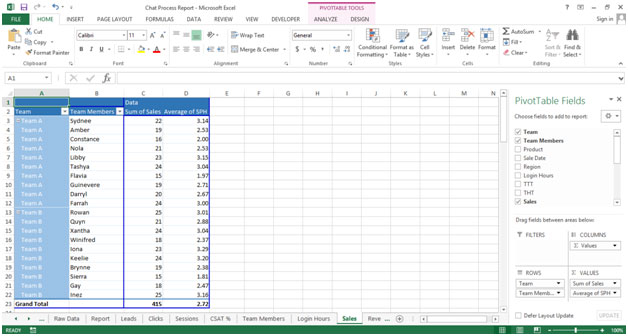
The screenshot below displays Team, Team Members, Sum of Sales and Average of SPH
The screenshot below displays Team, Team Members, Sum of Revenue and Average of RPH
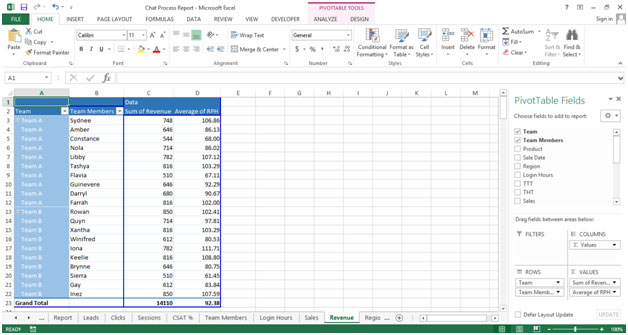
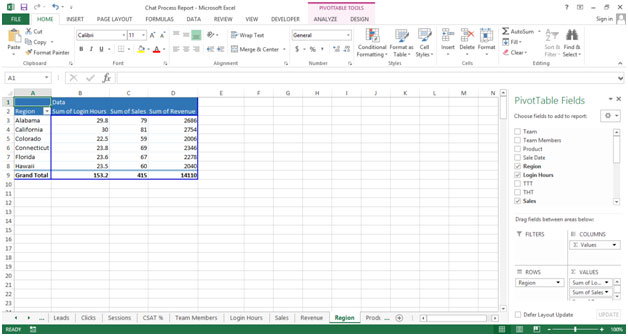
The screenshot below displays Region, Sum of Login Hours, Sum of Sales and Sum of Revenue
The screenshot below displays Team Members, Team A, Team B and Grand Total
If you liked our blogs, share it with your friends on Facebook. And also you can follow us on Twitter and Facebook.
We would love to hear from you, do let us know how we can improve, complement or innovate our work and make it better for you. Write us at info@exceltip.com
The applications/code on this site are distributed as is and without warranties or liability. In no event shall the owner of the copyrights, or the authors of the applications/code be liable for any loss of profit, any problems or any damage resulting from the use or evaluation of the applications/code.
I could not read or study the tool. Can you email a copy to me?
I will appreciate.