
The Sparklines are the small charts that reside in a single cell. Sparklines are used to show trends, improvement and win-loss over the period. The sparklines are charts but they have limited functionalities as compared to regular charts. In spite of its limitations, sparklines provide features like highlighting, min and maximum points, first point, last point and negative points. There are many other features sparkline provides, which we will explore in this article.
Since the introduction of sparklines in Excel 2010, it has evolved. I am using excel 2016 and I will explain these in-cell charts in this version.
How To Insert Sparkline Chart in Cell?
Now you have your sparkline chart in one single cell.
Some points you should know about these in-cell charts.
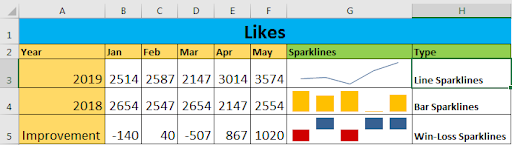
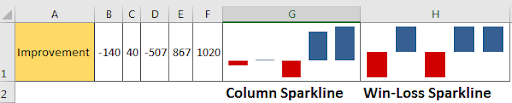
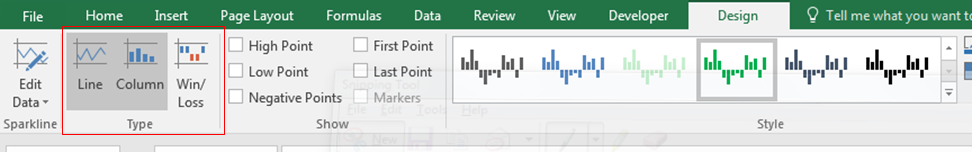
Types of Sparkline Chart in Excel
There are three types of Sparklines in Excel.
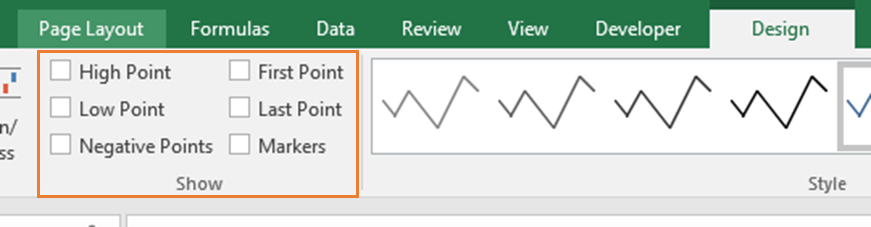
Highlight Points in Sparkline
It is common but important to highlight points in graphs, so that you can grab attention of management and help make better decisions. The sparkline in excel provides this feature too. You can highlight these below points in these in-cell charts.
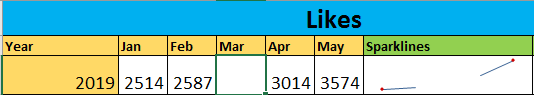
Handling Empty Cells in Sparkline
By default, If your data contains empty cells, the sparkline is shown broken, if its a line sparkline. In other words, sparkline just don’t show that point. Hidden cell points are ignored and not shown in the graph.
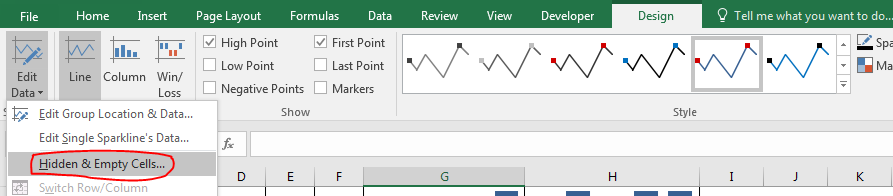
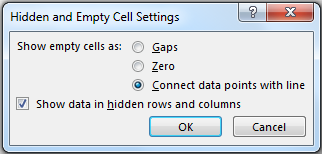
Excel provides option to handle these cases.
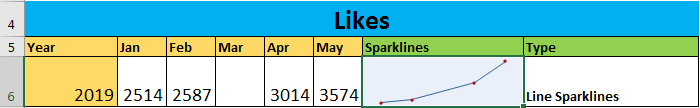
You can clearly see, the blank cell is ignored here. The Excel sparkline is only showing four points.
Axis in Sparkline
By default, all the points in the graph are shown relative to the smallest point in the sparkline. For example, in below data, 2147 is the smallest point. We can see that it is shown too low on the graph. But it, itself a large point.
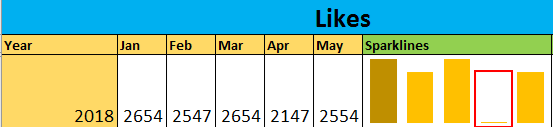
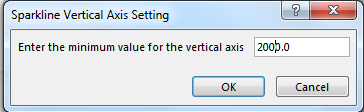
You may not want this to happen. You would like to set an axis to 2000, as all values are above this value. Excel gives you the option you to set the lowest or highest point of sparklines.
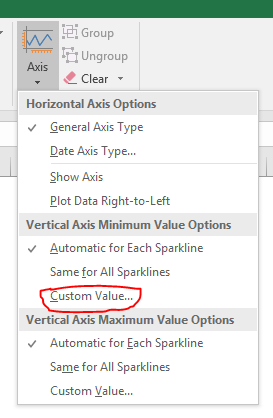
Follow these steps to edit Axis of Sparkline:
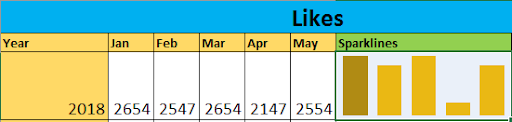
You can see the change now.
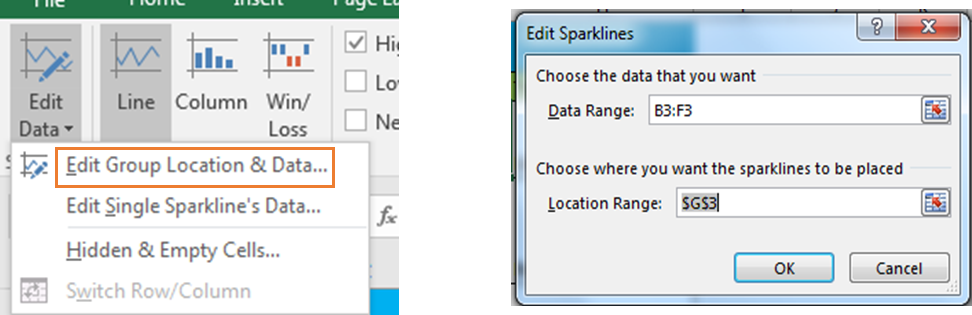
Change Data Source And Location of Sparkline
So, if you want to change data source or location, you can do that too.
Sparkline Formatting
It’s there is some scope of formatting the sparkline charts.
How to change sparkline type?
To change a sparklines type follow these steps.
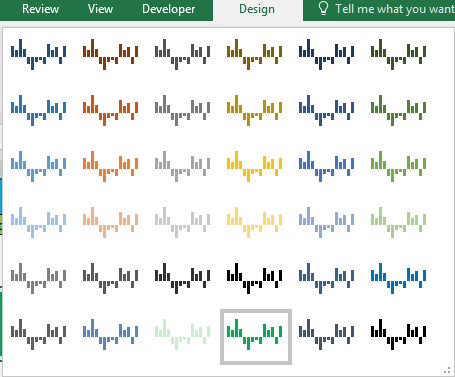
How to change sparkline style?
Sparklines have some predesigned styles. You can change design of sparklines following these steps.
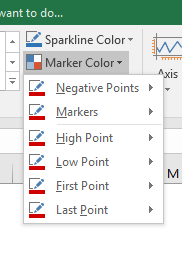
How to change sparkline’s color and markers color?
And it’s done.
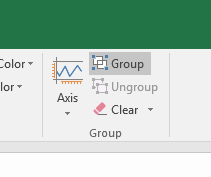
How to group sparklines?
Once you group the sparklines, all of them will be formatted same as the upper-left sparkline.
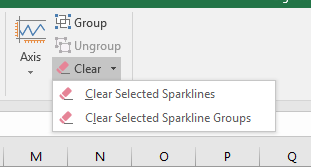
How to Delete a Sparkline?
You can’t delete the sparkline by simply pressing delete key on keyboard. To delete a sparkline chart follow these steps.
You can also delete the cell, column or row that contains the sparkline to delete it. Just make sure it doesn’t affect your data.
So, this is all about the sparkline in Excel. If you have any sparkline tricks under your sleeves, please do share with us in the comments section below.
Download file:
Related Articles:
Add Trend Line in Excel
Pie Charts bring in Best Presentation for Growth in Excel
Perform “Waterfall” Chart in Microsoft Excel
Popular Articles
50 Excel Shortcut to Increase Your Productivity : Get faster at your task. These 50 shortcuts will make you work even faster on Excel.
How to use the VLOOKUP Function in Excel : This is one of the most used and popular functions of excel that is used to lookup value from different ranges and sheets.
How to use the COUNTIF function in Excel : Count values with conditions using this amazing function. You don't need to filter your data to count specific values. Countif function is essential to prepare your dashboard.
How to use the SUMIF Function in Excel : This is another dashboard essential function. This helps you sum up values on specific conditions.
The applications/code on this site are distributed as is and without warranties or liability. In no event shall the owner of the copyrights, or the authors of the applications/code be liable for any loss of profit, any problems or any damage resulting from the use or evaluation of the applications/code.


