In this article, we will learn How to save your workbook as a template in Excel.
Templates in Excel
Users who are working on excel for a long time get obsessed with the custom styles. For example creating excel files for all employees or same subtotal groups for all vendors. You wouldn't prefer doing on your own. So just save your first workbook as a template and Access it any time you want.
Save as template in Excel
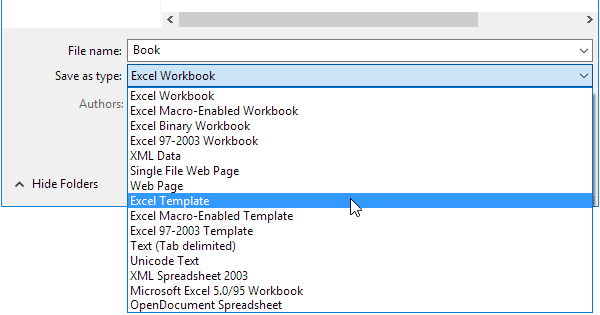
Go to File > Save As > Enter workbook Name (File Name) > Excel Template ( Save As Type: select from the drop down list )
Usages:
Example :
All of these might be confusing to understand. Let's understand how to use the function using an example. Here we have some sample workbook to save as template

Follow the steps
Complete your workbook and go to File > Save as. Now to save your work with a filename and Save as type: Excel Template as shown below.

This option enables you to save your workbook and access it with the same names under used templates.
Here are all the observational notes using the formula in Excel
Notes :
Hope this article about How to use the ... function in Excel is explanatory. Find more articles on calculating values and related Excel formulas here. If you liked our blogs, share it with your friends on Facebook. And also you can follow us on Twitter and Facebook. We would love to hear from you, do let us know how we can improve, complement or innovate our work and make it better for you. Write to us at info@exceltip.com.
Related Articles :
4 Creative Target Vs Achievement Charts in Excel : These four advanced excel charts can be used effectively to represent achievement vs target data. These charts are highly creative and self explanatory. The first chart looks like a swimming pool with swimmers. Take a look.
Best Charts in Excel and How To Use Them : These are some of the best charts that Excel provides. You should know how to use these charts and how they are interpreted. The line, column and pie chart are some common and but effective charts that have been used since the inception of the charts in excel. But Excel has more charts to explore...
Excel Sparklines : The Tiny Charts in Cell : These small charts reside in the cells of Excel. They are new to excel and not much explored. There are three types of Excel Sparkline charts in Excel. These 3 have sub categories, let's explore them.
Change Chart Data as Per Selected Cell : To change data as we select different cells we use worksheet events of Excel VBA. We change the data source of the chart as we change the selection or the cell. Here's how you do it.
Popular Articles :
How to use the IF Function in Excel : The IF statement in Excel checks the condition and returns a specific value if the condition is TRUE or returns another specific value if FALSE.
How to use the VLOOKUP Function in Excel : This is one of the most used and popular functions of excel that is used to lookup value from different ranges and sheets.
How to use the SUMIF Function in Excel : This is another dashboard essential function. This helps you sum up values on specific conditions.
How to use the COUNTIF Function in Excel : Count values with conditions using this amazing function. You don't need to filter your data to count specific values. Countif function is essential to prepare your dashboard.
The applications/code on this site are distributed as is and without warranties or liability. In no event shall the owner of the copyrights, or the authors of the applications/code be liable for any loss of profit, any problems or any damage resulting from the use or evaluation of the applications/code.