The NORM.DIST (earlier NORMDIST) function in Excel is used for calculating normal distribution of value in a set of data.
Syntax of NORM.DIST
x: The value of which you want to get Normal Distribution
Mean: the mean of the dataset
Standard_dev: standard deviation of data.
Cumulative: A boolean value. 1 if you want cumulative distribution. 0 for probabilistic distribution of the number.
NORMDIST in Excel has to modes.
How to Calculate Cumulative Distribution Function in Excel
Cumulative Distribution: It is also called CDF. CDF stands for Cumulative Density Function. This is the total probability of anything ‘to’ or ‘below’ of a given number. CDF is calculated using NORMDIST or NORM.DIST function of excel. You just need to pass, 1 or true as a cumulative argument.
CDF in Excel Example
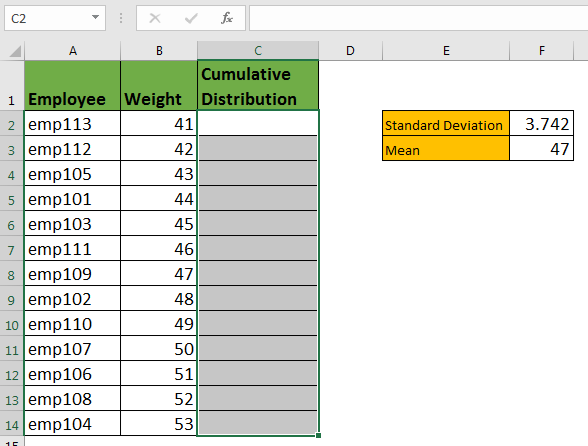
Assume that you have gathered data about the weight of female employees (I don’t know how you managed it). From this data, you want to know what is the probability of an employee weighing 50 kgs or less. For this, you need to calculate the Cumulative Distribution Function for each employee’s weight. To do so, we first need to get the mean and standard deviation of the data we have gathered.
Use STDEV.P function for standard deviation and AVERAGE function for MEAN.

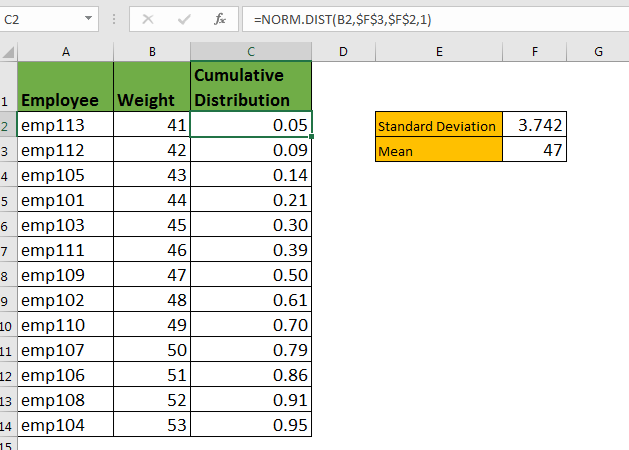
Write this NORMDIST formula in cell C2 and drag it down.
Here, B2 contains the number of which we want to get CDF. It is a relative reference so that it changes when copied below. Next, we have given absolute references for mean and standard deviation, respectively.
The NORM.DIST function will return below result.

This CDF’s tell us the probability of any number below that given number. Now, we know that there are 79% chances of a person weighing 50 kgs or less in your company.
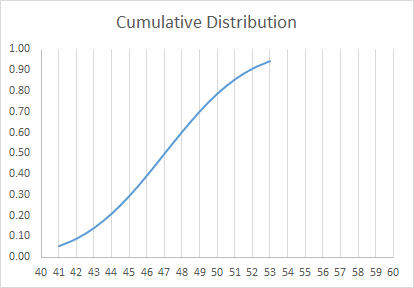
The graph shown below is visualisation of CDF in Excel.

The CDF graph in excel will always look like this if data is sorted ascendingly. Because as the name suggests the NORM.DIST calculates cumulative probability. If you want to just know the probability of a number at a point in a data set, you should use PDF.
How to Calculate Probability Distribution Function in Excel
The NORM.DIST function is also used for calculating PDF in Excel. The Probability Distribution Function tells the probability of occurrence of a given number in a population. For example, you may want to know what is the probability of a women weighing 60 kilos.
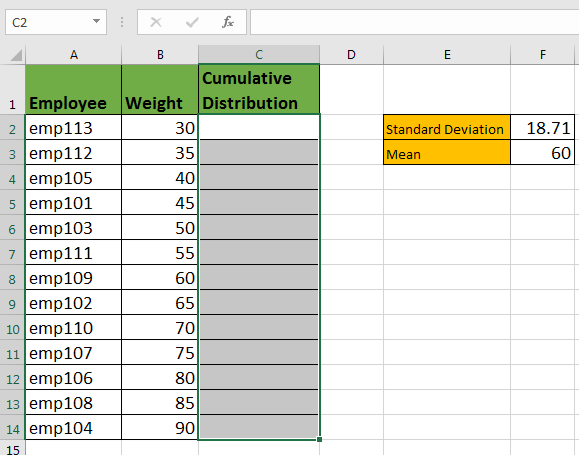
We have prepared another data from men in your organisation.

I have already calculated the standard deviation and mean of the data. Just writ this NORM.DIST formula in C2 and copy in below cells.
Now you have the probability of each weight in data. It says that there are 2% chances of a person weighing 60% kgs.
The graph of PDF is normally looks like below image.

This is also called bell curve graph.
So yeah guys, this is the NORM.DIST function of excel. You can easily use this function in excel to calculate the probability of a number appearing in data set without worrying about the complex mathematics behind normal distribution function.
Related Articles :
How to use Excel NORM.DIST Function : Calculate the Z score for the normal cumulative distribution for the pre specified values using the NORMDIST function in Excel.
How to use Excel NORM.INV Function : Calculate the inverse of Z score for the normal cumulative distribution for the pre-specified probability values using the NORM.INV function in Excel.
How to Calculate Standard Deviation in Excel : To calculate the standard deviation we have different functions in Excel. The standard deviation is the square root of the variance value but It tells more about the dataset than variance.
Regressions Analysis in Excel : Regression is an Analysis Tool, which we use for analyzing large amounts of data and making forecasts and predictions in Microsoft Excel.
How to Create Standard Deviation Graph : The standard deviation tells how much data is clustered around the average of the data. Learn how to create a standard deviation graph here.
How to use the VAR function in Excel : Calculate the variance for the sample dataset in excel using the VAR function in Excel.
Popular Articles :
How to use the IF Function in Excel : The IF statement in Excel checks the condition and returns a specific value if the condition is TRUE or returns another specific value if FALSE.
How to use the VLOOKUP Function in Excel : This is one of the most used and popular functions of excel that is used to lookup value from different ranges and sheets.
How to use the SUMIF Function in Excel : This is another dashboard essential function. This helps you sum up values on specific conditions.
How to use the COUNTIF Function in Excel : Count values with conditions using this amazing function. You don't need to filter your data to count specific values. Countif function is essential to prepare your dashboard.
The applications/code on this site are distributed as is and without warranties or liability. In no event shall the owner of the copyrights, or the authors of the applications/code be liable for any loss of profit, any problems or any damage resulting from the use or evaluation of the applications/code.