
The T TEST or Student’s test is used to determine the confidence of an analysis. In mathematical term, it is used to know if the mean of the two samples are equal. T.TEST is used to accept or reject the null hypothesis.
(Null hypothesis states that there is no significant difference in mean due to a given reason between two groups.)
Let’s say, we do a survey on two groups. In the end, we get the mean of these surveys and conclude that group 1 has done better from group 1 due to a reason. But how confident we are, that it is not just a fluke but there’s a large possibility of it. This is determined by T.TEST. Soon we will see an elaborated example.
Group1: the first group of experiments.
Group2: the second group of experiments. It can have the same subject as of group1, different subjects with the same variance and different subjects with different variance.
Tails: it has two options, 1 tailed, and 2 tailed. 1 tailed T TEST is used when we know that the effect of the experiment is one-directional. 2 tailed T TEST it is used when we don't know the direction of the effect of the experiment.
Types:
There are three options available (1,2,3).
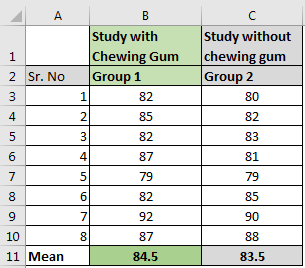
One of my friends said that while studying, chewing gum helps you memorize. To test this I conducted an experiment between two groups. Group 1 studied while chewing gum and group 2 studied normally. I collected the data and calculated the mean in Excel. The average score of group 1 is slightly greater than group 2.
So can we conclude that there is a positive effect of chewing gum? It seems so. But it can be a fluke. To confirm that this is not a fluke, we will conduct a T TEST on this data in Excel.
Null Hypothesis (H0): There is no difference in score due to studying while chewing gum.
Assume that the subjects of these two groups are the same. We also assume that the effect of this experiment will be one-directional. We will write this formula to get 1 tailed T-TEST with the paired group.
The Excel function returns t test value as 0.175.
We get the critical value of T TEST using this table. We use a degree of freedom (n-1) as 7.
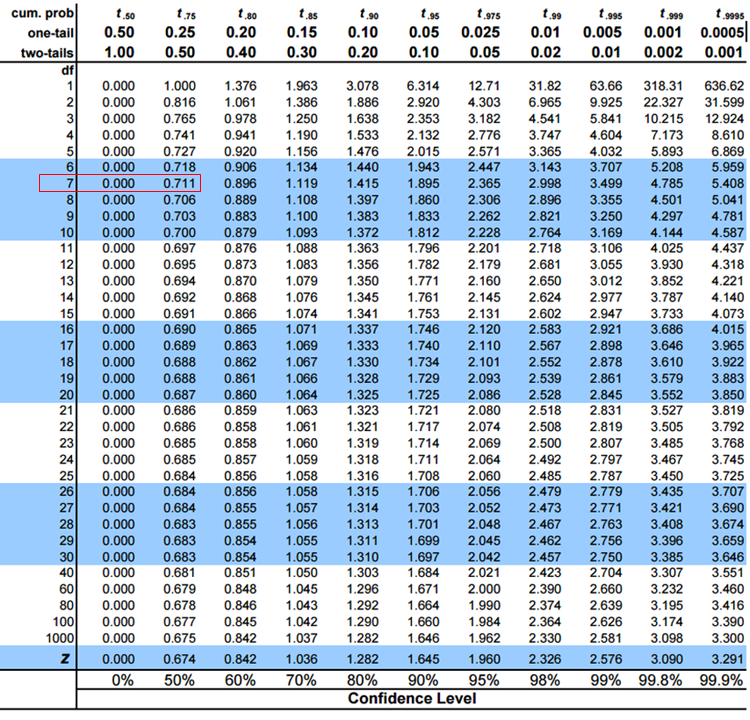
We can see that the confidence level is between 0% to 50%. This is too low. Hence we accept the null hypothesis.
Two Tailed T Test
Similarly for 2 tailed T TEST we will write this formula
This will result 0.350. Which double of 1 tailed T.TEST.
So yeah guys, this how T.TEST function works in excel. This was a tutorial for using T.TEST Function in excel. That’s why we didn’t deep dived in student’s t test functionality and mathematical back ground. We will discuss student’s t test in later articles, if you want. Let me know, if you have any doubts regarding this or ony other topic in excel function.
Related Articles:
How to Create Standard Deviation Graph in Excel
How to Use VAR Function in Excel
How to Use STDEV Function in Excel
How to Use SUBTOTAL Function in Excel
How to use the Excel LOG10 function
How to use the IMEXP Function in Excel
How to use the IMCONJUGATE Function in Excel
How to use the IMARGUMENT Function in Excel
Popular Articles
If with conditional formatting
The applications/code on this site are distributed as is and without warranties or liability. In no event shall the owner of the copyrights, or the authors of the applications/code be liable for any loss of profit, any problems or any damage resulting from the use or evaluation of the applications/code.


