Some times we want to group data by age to analyse data. This data analysis can tell us something about the effect of the age on certain fector. We can use it see the frequency between different age groups in data. There are several ways to group data age wise but the best way is the pivot table group by range.

Let’s see an example to make things clear.
Example: Group Employees by Age in Pivot Table

Here I have list of 43 employees and their sales of a month. I have their aging details too. Now I want to see, if there is some significant difference in sales of different age groups. I want too make a report with age starting from 20 and ending at 70 with interval of 20.
To group the above data age wise, follow these steps:


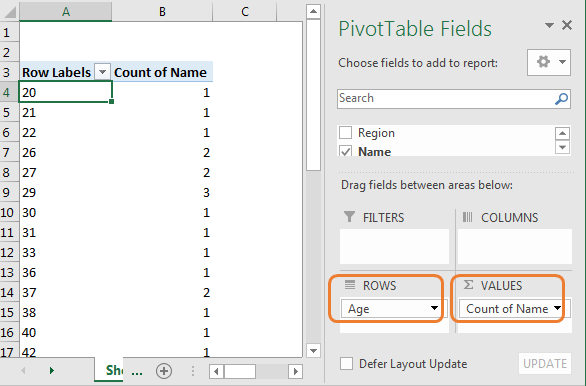
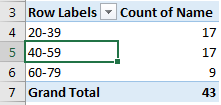
We can see that every age is listed here. We can see how many employees are of which age. But this not what we want. Right? To group them into intervals of 20 years, right click on any age label and click on group.


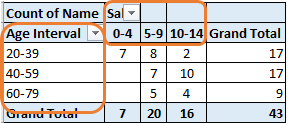
This same thing can be done with columns. For example, if I want to see sales interval of 0-5, 5-10, and onwards, with cross section of age intervals; then I will drop sales in columns and follow above mentioned steps to group them.

Actually pivot table automatically evaluates the data and suggests the possible way to group data. Since this example had numbers, it suggested to group table by simple number intervals. If these were dates than, excel would have suggested, group by month, year etc.
So yeah guys, this how plot a pivot table, grouped by age range in excel. This quite easy to do. If you have any doubts regarding this article or any other excel topic, take it out in the comments section below.
Related Articles:
Show hide field header in pivot table
Popular Articles:
The VLOOKUP Function in Excel
The applications/code on this site are distributed as is and without warranties or liability. In no event shall the owner of the copyrights, or the authors of the applications/code be liable for any loss of profit, any problems or any damage resulting from the use or evaluation of the applications/code.