Charting in Excel is a great way to represent data. The viewer can easily understand data & what exactly going on through charts. In case you need to create too many charts on the same format, then this tutorial is surely going to help you in saving time. In this article, we will learn how to create chart, using VBA code.
Question): I urgently need a way to automatically make a specific type of chart say bar chart or column chart. The data is in fixed formats. Can someone please help?
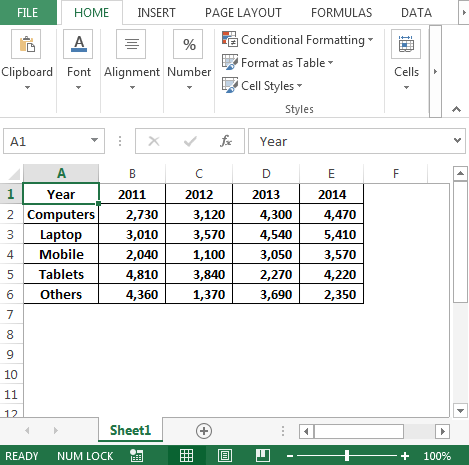
Following is the picture of data we have:

We need to follow the below steps to launch VB editor
Enter the following code in the standard module
ActiveSheet.Shapes.AddChart2(201, xlColumnClustered).Select
ActiveChart.SetSourceData Source:=Range("Sheet1!$A$1:$E$6")
End Sub


In this way, we can create automated charts, using macros.

The applications/code on this site are distributed as is and without warranties or liability. In no event shall the owner of the copyrights, or the authors of the applications/code be liable for any loss of profit, any problems or any damage resulting from the use or evaluation of the applications/code.