About Dashboard:
This dashboard shows company’s financial summary on industry estimated Vs. actual revenue, revenue by region, revenue by product, sales rep performance.
This review is for business owner who needs an intuitive financial dashboard on a daily basis, but more so, needs the ability to forecast and run scenarios to grow a company.
In today’s world there is a huge pressure on the management to provide faster and transparent information which helps in determining company’s overall performance. It tracks financial data which helps to see the growth from various perspective of the industry.
There are several ways in which you can visualize financial data to understand the company’s goal. In October month, Excelforum team has launched a dashboard competing in which you are asked to visualize financial data using sample data. The challenge has generated a huge thrill around the community and fetched 118 incredible entries.
In this article, we will show you the steps on how to create this dashboard.
Let us see the how Dashboard made by Figures looks:

We have divided this dashboard into 5 sections of information. Let us take a look at each one separately.
Section1:
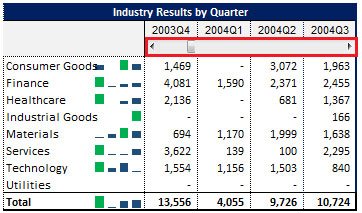
In this section,we can see industry results by quarter in the below table. There is a scrollbar used which provides flexibility to viewer to select the performance by different quarter & then it will be easy for comparison.

Section2:
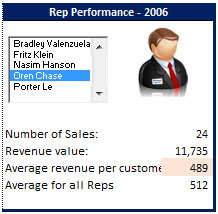
This section shows sales rep performance by number of sales, revenue value generated, average revenue per customer, average for all reps.

There is a list box used which can be used to select sales rep name & all the information gets updated automatically.

Section3:
The below is picture of table which is showing Actual & Estimated Yearly Revenue for Product by Industry.

In above table, radio buttons provide the facility to select any product & the result will be calculated automatically. There is conditional formatting used to show actual revenue is higher than estimated revenue or vice versa.
Section 4:
This section shows revenue by region which is controlled by the drop down list contains the option to select year. In the middle section there is a map & on the right hand side there is a chart, both will dynamically update as the yearly criteria is changed in drop down list.

With the selection of different year, all the information will gets updated automatically refer below snapshot:

Section 5:
This section shows revenue over time by two charts.

The above chart contains slicers which can be used to filter down the information & the result will get updated & shown.
There are two charts, the first one shows the product revenue by quarterly. The second is a pie chart which shows the contribution by region in percentage for the selected year & quarter in slicers.
Using this dashboard you can get a clear view of the financial industry and we can get the information from various point of view.
If you liked our blogs, share it with your friends on Facebook. And also you can follow us on Twitter and Facebook.
We would love to hear from you, do let us know how we can improve, complement or innovate our work and make it better for you. Write us at info@exceltip.com
The applications/code on this site are distributed as is and without warranties or liability. In no event shall the owner of the copyrights, or the authors of the applications/code be liable for any loss of profit, any problems or any damage resulting from the use or evaluation of the applications/code.
Can I know how to format the Variance with Arrow like this dashboard?
Very good job, I have learnt so many things related to Excel from your website, please keep posting and let me know how can I get the information of new articles.
Thanks
Harry
Hi Harry,
Thanks for taking time for appreciating us!.
You can easily get the notification on our new articles which get uploaded daily on our website at your email by clicking on the "Follow" button you will find at the end of the article. Just click on that, leave your email address and get daily notification.
Do let us know in case you need anything else too. 🙂
Thanks
Site Admin
can i get a link to download
thx.
Excellent Job. how to download it?
Excellent ! Can you send a link to download this file ? Thank you very much.
It's amazing dashboard how I can download it