
About Dashboard:
This dashboard shows company’s financial summary on industry estimated vs. actual revenue, revenue by region, revenue by industry, revenue by product, revenue by quarter, revenue by year, revenue by sales rep. This dashboard provides flexibility to the viewer to compare from various perspectives.
There are 7 dynamic charts & 7 dynamic tables. The beauty of this dashboard is that it contains all the information in a short space. The contestant has used basic but very effective techniques like pivot table, dynamic charts with the use of check boxes, conditional formatting, timeline.
The best part of this dashboard is that it contains the whole raw data in the dashboard itself.
This review is for the business owner who needs an intuitive financial dashboard on a daily basis, but more so, needs the ability to forecast and run scenarios to grow a company.
In today’s world, there is a huge pressure on the management to provide faster and transparent information, which helps in determining company’s overall performance. It tracks financial data, which helps to see the growth from various perspectives of the industry.
There are several ways in which you can visualize financial data to understand the company’s goal. In October, ExcelForum team launched a dashboard competition in which you were asked to visualize sample data. The challenge has generated a huge thrill around the community and fetched 118 incredible entries.
In this article, we will show you the steps on how to create this dashboard.
Let us see how the Dashboard made by Prince Sethi looks:

We have divided this dashboard into 9 sections of information. Let us take a look at each one separately.
Section1:
In this section,we will see the smart way of using check box, charts & timeline feature, which takes less space on the screen & at the same time shows all the relevant information that the viewer would like to see.

The above chart gives freedom to viewer to select the drop down list to pick from various options like revenue by region, industry, product, quarter, year & sales rep.

If we want to view the revenue by product then, we can simply select the product from the drop down list & the chart will be updated dynamically.

In the above chart, we can see all the products listed, there are check boxes used, which allows us to make comparison between products.
The below picture contains estimated revenue & actual revenue checkboxes. In case we want to view the actual revenue by selected products then the dynamic chart provides the option.
![]()
To view the actual revenue by couple of sales rep, we need to select Sales Rep from the drop down list & uncheck the estimated revenue check box.

Section 2:
The timeline feature provides the selection of date by quarter & year.

The selection of date from timeline feature is directly linked with the below 6 charts & tables.
Section 3:
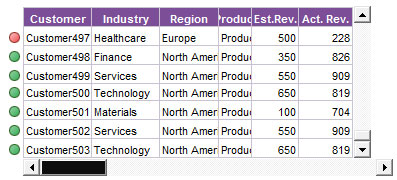
This section shows the raw data, used to develop this dashboard.Refer below snapshot:

There is conditional formatting used to visually indicate the viewer, the green color balls refers Actual Revenue is higher than Estimated Revenue; while red color balls shows the Actual Revenue is lower than Estimated Revenue.
There are vertical & horizontal scrollbars used, which can be used to refer to the raw data behind this dashboard. Hence, the viewer is not required to go to any other sheet to view the raw data.

Section 4:
The below chart shows estimated & actual revenue by Industry. We can select the subcategory from the pivot table & it will show the selected Industry revenue only.

Section 5:
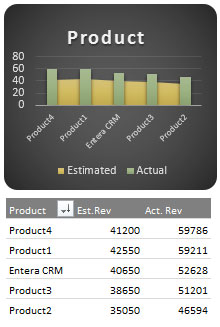
The below chart shows estimated & actual revenue by Product. We can select the subcategory from the pivot table & it will show the selected Product revenue only.
Section 6:
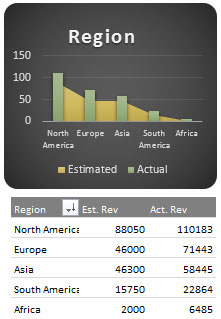
The below chart shows estimated & actual revenue by Region. We can select the subcategory from the pivot table & it will show the selected Region revenue only.
Section 7:
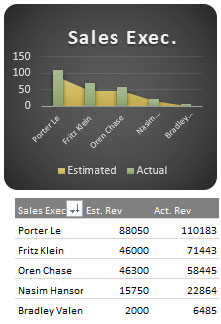
The below chart shows estimated & actual revenue by Sales Executive. We can select the subcategory from the pivot table & it will show the selected Sales Executive revenue only.
Section 8:
The below chart shows estimated & actual revenue by Quarter. We can select the subcategory from the pivot table & it will show the selected Quarter revenue only.
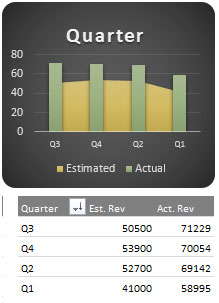
Section 9:
The below chart shows estimated & actual revenue by Years. We can select the subcategory from the pivot table & it will show the selected Years revenue only.
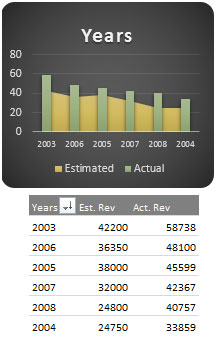
The slicers are filtered according to Industry, Product & year. If we select any particular industry with product & year combination then all the data will be interactively updated.
Using this dashboard we can get a clear view of the financial industry and thus we can get the information from various points of view.
The applications/code on this site are distributed as is and without warranties or liability. In no event shall the owner of the copyrights, or the authors of the applications/code be liable for any loss of profit, any problems or any damage resulting from the use or evaluation of the applications/code.
Hi all,
You can download the dashboard from the link provided at the last or click this link for downloading
https://www.exceltip.com/finance/financial-dashboard-by-princesethi.html
Regards,
Exceltip Team
Hi Sir,
I love the whole concept. Smart analysis.
I want to have a copy of this excel financial dashboard.
Kindly send me a copy to my email please: vicente.borres@gmail.com
Can you share the steps how I can create this dashboard... I am already having 2013. I am having knowledge of function-formulas but a basic knowledge of vba....Section 3 looking impressing...seeking your help to understand this.
Hi all,
You can download the dashboard from the link provided at the last or click this link for downloading
https://www.exceltip.com/finance/financial-dashboard-by-princesethi.html
Regards,
Exceltip Team
Sir, There is no link to download it...could you please forward it on my mail id
kirtijais0305@gmail.com
Hi Sir,
I love the whole concept. Smart analysis.
I want to have a copy of this excel financial dashboard.
Kindly send me a copy to my email please: vicente.borres@gmail.com
How Can I download this Dashboard
Good One
nice one.....................
Wow...