About Dashboard:
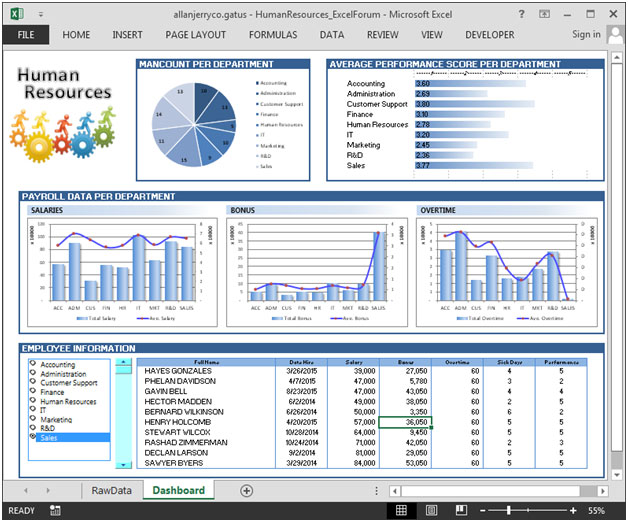
This dashboard focuses on Human Resource department’s real-time visibility of the data, of an organization. There are 5 dynamic charts & 1 dynamic table.
With this dashboard, we can track various human resources statistics like man count, average performance score per department, payroll& employee information.
There are several ways in which you can visualize HR data to understand the objectives. In October, ExcelForum team launched a dashboard competition in which you were asked to visualize sample data. The challenge has generated a huge thrill around the community and fetched 118 incredible entries.
In this article, we will show you the steps on how to create this dashboard.
Let us see how the Dashboard made by allanjerryco.gatuslooks:

We have divided this dashboard into 4 sections of information. Let us take a look at each one separately.
Section1:
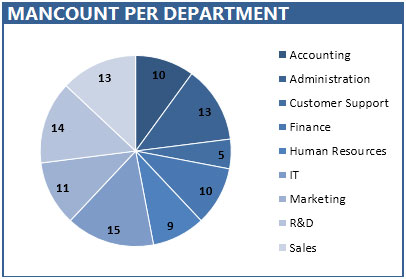
This section will cover count of man by department.

From the above chart, HR can look at the number of employees working in each department. This will help them in future planning,for analysingifhiring is required or not in any department. The highest head count is of the IT department where 15 employees are working while Customer Support department count is the lowest at 5.
Section2:
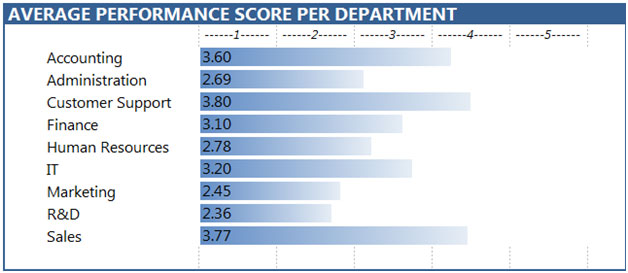
This section shows average performance score per department. The Customer Support department has the highest among all the departments.

Section3:
The following picture will show payroll distribution by salary, bonus & overtime.

From the above chart, we can easily track the salary, overtime & bonus of the employees.
Section4:
The following picture shows the employee information like full name, hire date, salary, bonus, overtime, sick days & performance score in the table. All this information is linked to the drop down list, with the selection of the department in the left portion of the screen.

There is scrollbar which can be used to see all the employees in the selected department.
Using this dashboard we can get a clear view of the Human Resource;and thus we can get the information from various points of view.
The applications/code on this site are distributed as is and without warranties or liability. In no event shall the owner of the copyrights, or the authors of the applications/code be liable for any loss of profit, any problems or any damage resulting from the use or evaluation of the applications/code.
Hi There - I have tried to re-create the table with scroll bar, but there always appears to be one record which shows in the table, no matter what the selection is in the control box. Do you know why this might be and what I can do to fix it? I have tried everything!
Thanks in advance, ali
Thanks you for another great article. Where else could anyone get that kind of information in such a perfect way of writing? I have a presentation next week, and I am on the look for such information.
Quality content is the crucial to invite the visitors to visit the site, that's what this website is providing.