About Dashboard:
This dashboard focuses on Human Resource of an organization & provides employees’ information in detail.Human Resource Dashboard is a visual display of various metrics.
HR Dashboard can be designed in different ways and used for different things, but it’s mainly developed & designed keeping in view the important metrics.
With this dashboard, we can view employee’s information in detail like Sick Days, Overtime, Bonus &Previous Month Figures.
There are several ways in which you can visualize the HR data to understand the objectives.
In this article, we will show you the steps on how to create this dashboard.
Let us see how the Dashboard made by Apetis looks:

We have divided this dashboard into 4 sections of information. Let us take a look at each one separately.
Section1:
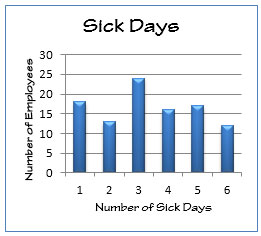
In this section, we will talk about the employees’sick details, in counts:

The below picture will show the total sick days by department through line chart.

Section2:
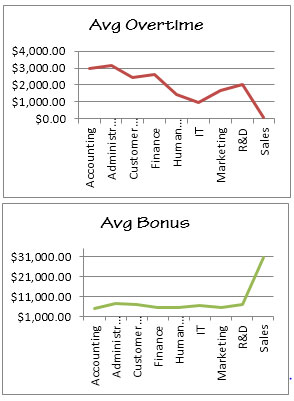
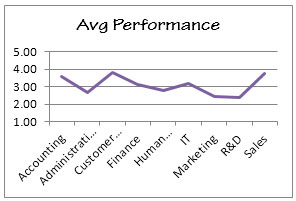
This section covers employees’ average performance, average overtime & average bonus department-wise.


Section3:
The following picture will show the comparison of overtime & bonus through scatter chart.

Section4:
The following picture provides information about performance by bonus comparison.

Section5:
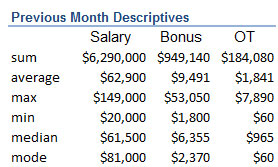
The following table shows the Salary, Bonus & Overtime information in detail through formulae.

Using this dashboard wecan get a clear view of the Human Resource;and thus we can get the information from various points of view.
The applications/code on this site are distributed as is and without warranties or liability. In no event shall the owner of the copyrights, or the authors of the applications/code be liable for any loss of profit, any problems or any damage resulting from the use or evaluation of the applications/code.
?here is definately a great deal to learn ?bout this issue. ? love all of the points you've mad?.