
About Dashboard:
Human resources: - Human Resources is play a very key role to an organization. Human resource are having so many responsibilities such as hire the candidate for a company, and ensuring they would be a good performer and check them previous records.
Human resources is work for to make the policies for company about the Leaves, Salary Distribution, Manpower, Employee Data Manage, Performance Allowances, and Provident Fund etc.
Human resources dashboards are useful to analyze the performance and improvement area of resources, employee satisfaction. We can finalize the salary standard for every levels and designation accordingly.
Let’s understand with a dashboard how we can prepare it and how it will be useful for us to analyze and maintain the company standard.
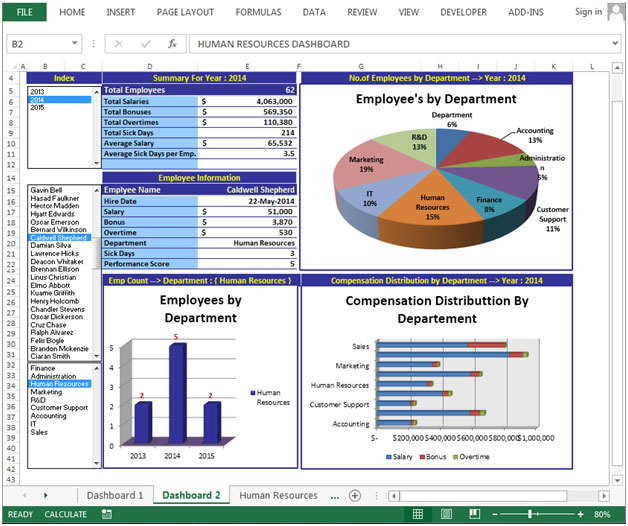
In the left side of the analyses few index are available, where we can select the criteria according to Year, Employee name, and department.
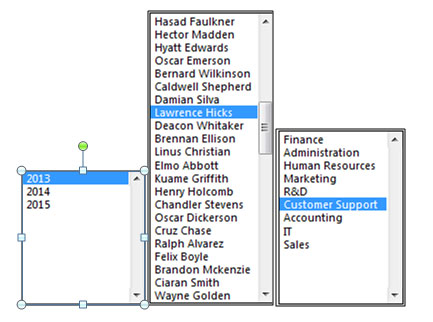
Summary Year Wise
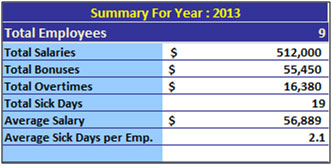
In the above shown table we can see the summary year wise to company. In this table mentioned such important information such as:- Total Salaries, Total Bonuses, Total Overtimes, Total Sick Days, Average Salary and Average Sick Days per Emp.
We can see this summary year wise, to change the year we have to select year from the year tab.
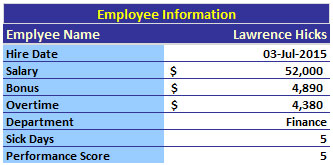
In the above shown table we can see the Employee information employee wise. In this table mentioned such employee information such as:-Employee Name, Hire Date, Salary, Bonus, Overtime, Department, Sick Days, Performance Score.
We can see this summary for every employee, to change the employee we have to select employee name from the tab.
Chart:-Headcount Department Wise

To show the headcount for every department used column chart. In this chart we can see the headcount year wise and department wise. To change the department we have to select another department form the tab. Chart will present the report according to selected department.
Chart:-Headcount Department Wise

To show the headcount for every department used 3D Pie chart. In this chart we can see marketing department headcount is more comparatively other departments and Administration headcount is very less in the all departments.
This chart is representing the report for year 2014, we can change the year through year tab then we will get the information accordingly.
Chart:-Payroll Breakdown
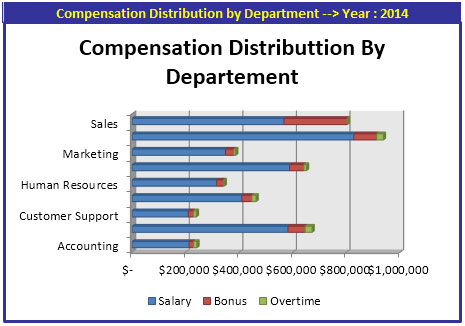
To show the payroll break down department wise used Bar Chart. In this chart we can see Payroll break down as bifurcated (Salary+Bonus+Overtime) year wise. Through this chart we can analyze that Sales department is taking the high bonus and salary from the all department.
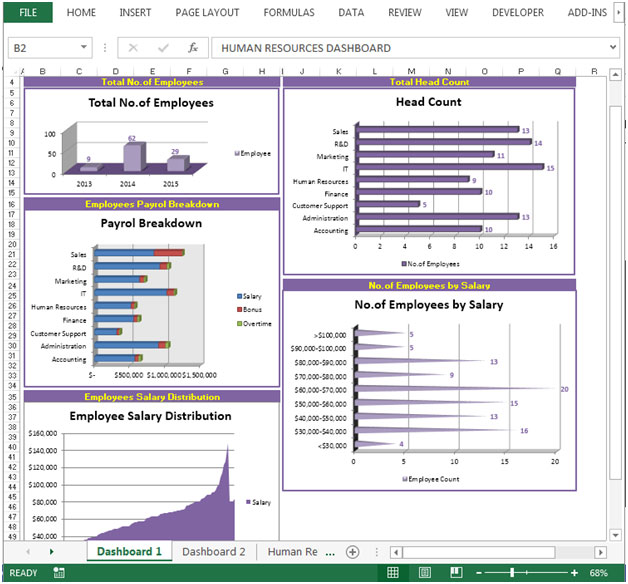
In this dashboard we can get the report overall company wise.

First chart is representing the report to total no. of employees on yearly basis.
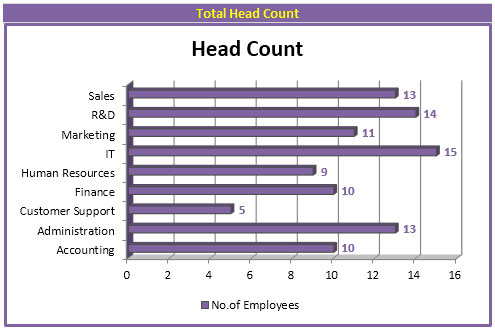
Bar chart is representing the report to head count department wise, where we can see that in which departments we have high headcount and low head count.
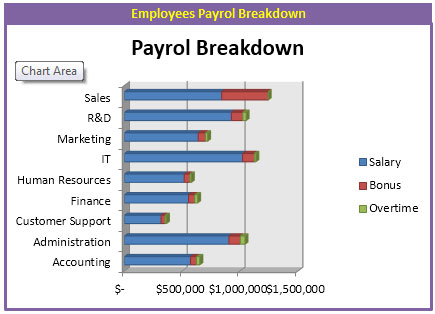
Bar chart is representing the report to payroll breakdown where we can see that which departments are getting high salary, bonuses, and overtime.

Area chart is used to show the employee salary distribution.
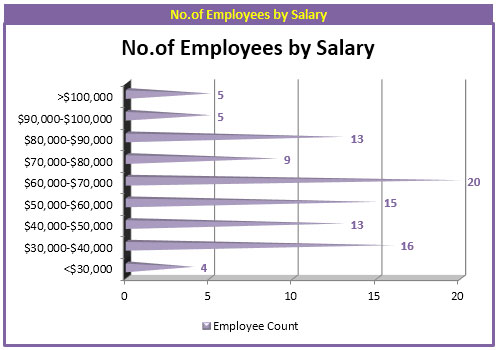
Bar chart used to show the no. of employee according to salary slab.
Chart:-Salary Distribution

To show the salary distributionused the combo chart to Area and Line chart. In this chart a median line is inserted we can analyses that below to median chart how much salary is distributing and above the median line how much salary is distributing.
Chart:-Sick Days per Department

In this chart to show the Sick days used combo chart of Column Chart and Line chart. We can analyze that how many employees have taken the sick days leaves, in this chart we can analyze that sales department have taken the more leaves to other departments.
Salary Slip
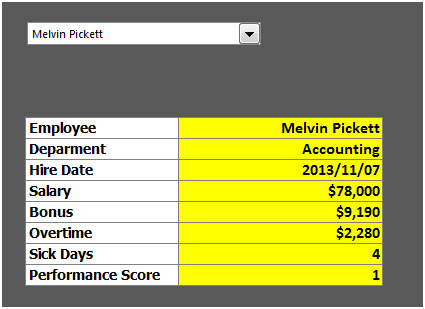
In this table we have salary slip in which few details are mentioned such as Employee name, Department, Hire Date, Salary, Bonus, Overtime, Sick Days, and Performance.
The applications/code on this site are distributed as is and without warranties or liability. In no event shall the owner of the copyrights, or the authors of the applications/code be liable for any loss of profit, any problems or any damage resulting from the use or evaluation of the applications/code.
Hello, would appreciate a link to this dashboard if you are willing to share.
Can I get a link please?
Please send me the link, also is there an HR dashboard to show different currency and showing a monthly report
Was a link for the dashboard ever provided?
Please send me the link, also is there an HR dashboard to show different currency and showing a monthly report
Could you send me a link to download this dashboard, Please.
Jjj
Me podría enviar un enlace para descargar este panel, por favor?
Podrían envíame un enlace para descargar este panel, por favor?
Can you send the dash board to given mail_id or provide the link to download . Thanks.
Could you send me a link to download this dashboard, Please.
Can I get a link to this please? Thanks!
please provide download link
look nice ! Can you sent a link to download the file ?
Please provide a link to use dashboard. Thank you.
Please provide the link to download and use the dashboard. fantastic job.
I also would like a link to download the file if possible please
is it possible to get a copy of this dashboard?
Super ! Can you sent a link to download the file ?
Is there a sample download for this dashboard available?
please provide the link to download.