
About Dashboard:
Human resources: - Human Resources is play a very key role to an organization. Human resource are having so many responsibilities such as hire the candidate for a company, and ensuring they would be a good performer and check them previous records.
Human resources is work for to make the policies for company about the Leaves, Salary Distribution, Manpower, Employee Data Manage, Performance Allowances, and Provident Fund etc.
Human resources dashboards are useful to analyze the performance and improvement area of resources, employee satisfaction. We can finalize the salary standard for every levels and designation accordingly.
Let’s understand with a dashboard how we can prepare it and how it will be useful for us to analyze and maintain the company standard.


In the dashboard we have the filters to select the criteria as per our requirement and analyses will get change according to selected area. We have filter criteria to see the report according to department, searching criteria, scroll button.
Chart:-Salary Breakup
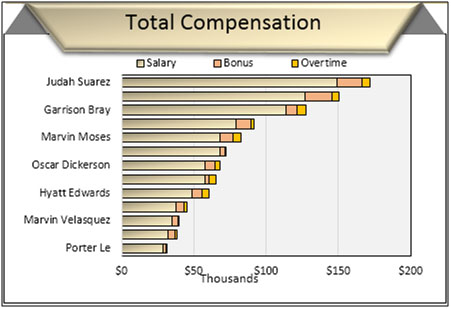
To show the Salary break up department wise used Bar Chart. In this chart we can see Salary breakup as bifurcated (Salary+Bonus+Overtime). Through this chart we can see the salary break to every department by selecting the department button.
Chart:-Sick Days per Department
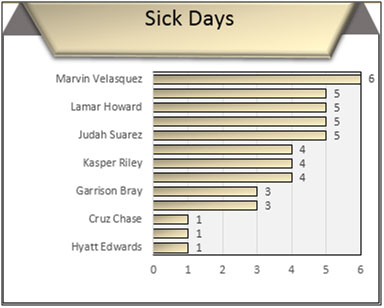
Bar chart used to show the sick days taken by the employees in every department. In this chart we can easily identify that Marvin had taken the 6 sick days from the Administration department.

In the first table we can see the total headcount, total salary amount, total bonus amount, total overtime amount, total compensation and Total sick days taken.
In the second table we can see the Average performance, Average Salary, Average bonus, Average Overtime, Average compensation, and average sick days.
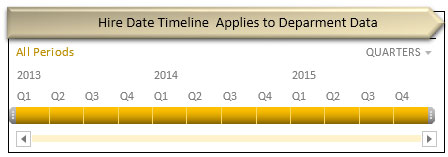
In this report we can see the hire date timeline applies to department data on quarterly basis to every year.

In this report we can see the comparison in betweenbonus as a % of salary vs performance scores.

In this table we have Employee search criteria, Scroll button and 2 tabs are there to search employee name by first name and last name.
In this table Employee details mentioned such as Employee name, Department, Hire date, Salary, Bonus, Overtime, Total Compensation, Sick Days, and Performance.
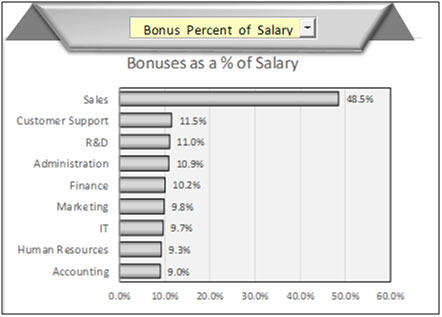
Bar chart had a drop down list, where we can put the filter according to requirement and chart will get change accordingly and present the report.
In this chart we can see the performance and details according to Average salaries, Average hire date, Bonus percent of salary, Bonuses, Overtimes, Performance, Salaries, Sick Days, Total Compensation to every department.

In this table we can see the highest and lowest from the total compensation.
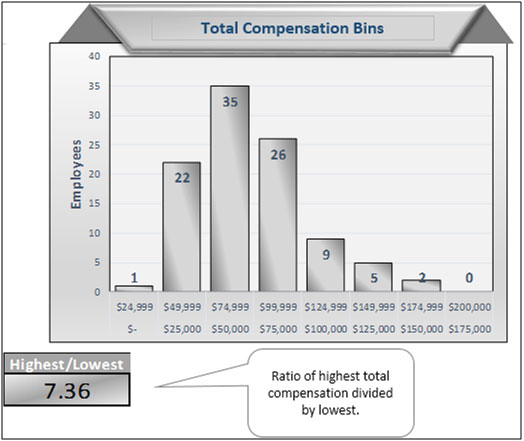
In this chart we can see salary criteria wise number of employees.
If you liked our blogs, share it with your friends on Facebook. And also you can follow us on Twitter and Facebook.
We would love to hear from you, do let us know how we can improve, complement or innovate our work and make it better for you. Write us at info@exceltip.com
The applications/code on this site are distributed as is and without warranties or liability. In no event shall the owner of the copyrights, or the authors of the applications/code be liable for any loss of profit, any problems or any damage resulting from the use or evaluation of the applications/code.
How did you put " Hire Date Timeline applies to Department data " ?
There is yellow color bar each Quarter. Did you use Macros for these bars ? OR from developer tab ?
can you please explain that ?
Hallo,
this looks awsome. May I have the link to download it. That would be nice. Thanks in advance.
I want to know performance formula. you can tell me please.
Excellent
It looks great. Am I able to get a download link please?
Good work ! Can I get a link to download this file ?