About Dashboard:
This dashboard visualizes employee and HR related information. It allows HR, managers and senior management to have a quick view of employee statistics including headcount, gross salary per department, payroll break up, break up of salary.
There are 4 charts & 1 table.HR Dashboard can be designed in different ways and can be used for different things, but it’s mainly developed & designed keeping in view of important metrics.
There are several ways in which you can visualize HR data to understand the objectives. In October month, Excel Forum team has launched a dashboard competing in which you are asked to visualize data using sample data. The challenge has generated a huge thrill around the community and has fetched 118 incredible entries.
In this article, we will detail the steps to create this dashboard.
Let us see how the Dashboard made by Syed Nazir looks:

We have divided this dashboard into 5 sections of information. Let us take a look at each one separately.
Section1:
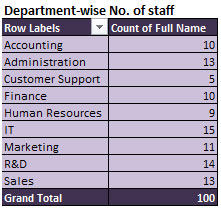
In this section, the table below shows the count of employees working in all the departments.

In IT department, the headcount is 15, which is the highest among all whereas 5 is the lowest headcount that to be in Customer Support department.
This is a pivot table,and it allows us to select one or multiple departments at one point of time, from the drop-down filter. The pivot table will show the staff count for the selected department.
Section2:
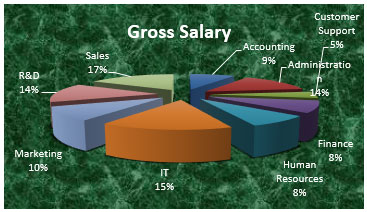
This section highlights gross salary for all the departments, in percentage. In IT department, 15 % of the gross salary from total is paid while Customer Support share is 5 %.It is due to the difference in head counts in both the departments.

Section3:
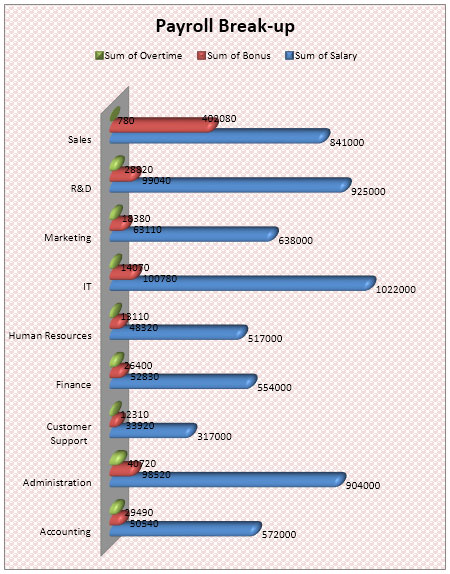
In the right portion of the screen, we can see the payroll break up by overtime, bonus & salary for all the departments.

Section4:
The following chart shows department-wise performance of sick days & performance score.

Section5:
In this last section, the chart below shows the total break up of salary by overtime, bonus & salary.

Using this dashboard,we can get a clear view of the Human Resource,and we can get the information from various points of view.
The applications/code on this site are distributed as is and without warranties or liability. In no event shall the owner of the copyrights, or the authors of the applications/code be liable for any loss of profit, any problems or any damage resulting from the use or evaluation of the applications/code.
I must say that while reading your post I found my thoughts in agreement with the topic that you have discussed, which happens very rare.
ez-autorental.org |
Very comprehensive with decent manner display of Human Resource