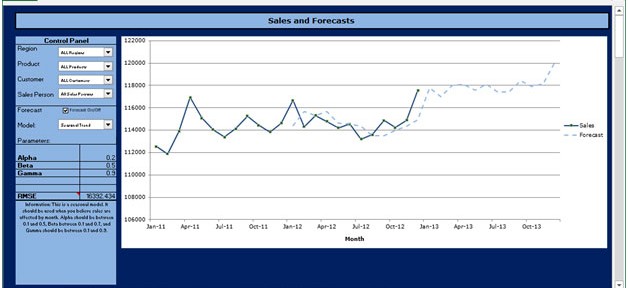
About Dashboard:
This dashboard shows company’s sales by region, product, customer and sales person, month wise. The focus of this dashboard is to provide Sales & Forecast.
With the flexibility provided in this dashboard, which enables selection of any combination from the dropdown menus, the dashboard gets updated automatically. This will help in tracking the team’s overall sales performance from different perspective. It provides transparent & clear information of the company to management which in turn helps in taking quick decisions.
There are several ways in which you can visualize sales data to understand the market trends and sales performance. In October month, Excel Forum team has launched a dashboard competing in which you are asked to visualize data using sample data. The challenge has generated a huge thrill around the community and has fetched 118 incredible entries.
Thanks everyone for participating and making it a huge learning experience for everyone. Excel forum team has learned several useful dashboard and charting tricks.
In this article, we will show you the steps to create this dashboard.
Let us see how Dashboard made by spdrmn55 looks like:
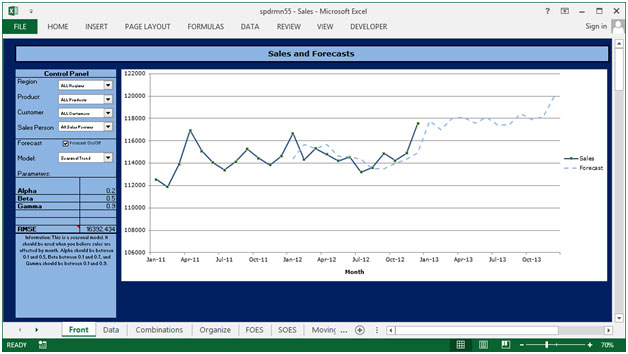
We have divided this dashboard into 3 sections of information. Let us take a look at each one separately.
Section1:
At the top left portion of the dashboard, we will find 4 options to select the information.
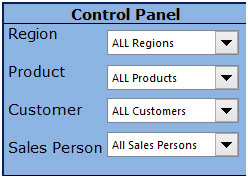
From above control panel, we can select any region, product, customer & sales person to find out the sales performance in the line chart, and it will be updated dynamically in the middle portion of the screen.
Section2:
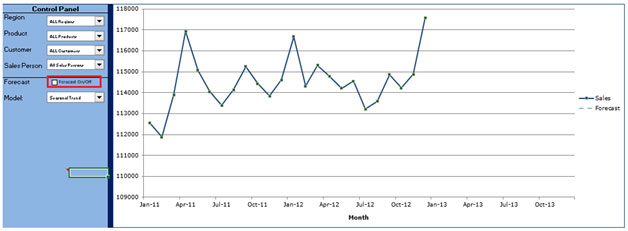
There is an option to see the chart without Forecast line in the chart; we can uncheck the Forecast On/off checkbox.
Section 3:
This section covers the Forecast.
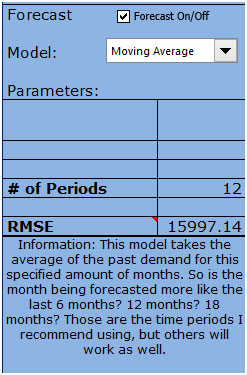
There is a Model dropdown that enables selection of the Forecast by Seasonal Trend, First Order Exponential Smoothing, Second Order Exponential Smoothing, Moving Average and Linear Regression.

With the selection from the dropdown, we get the related parameters updated dynamically. If we select Moving Average, then the below parameters will be instantly updated.
Using this dashboard,we can get a clear view of the Sales industry and we can get the information from various points of view.
The applications/code on this site are distributed as is and without warranties or liability. In no event shall the owner of the copyrights, or the authors of the applications/code be liable for any loss of profit, any problems or any damage resulting from the use or evaluation of the applications/code.
Excellent Work.
Getting error message: Excel found unreadable content when opening the file in Excel 2007. Is it possible to send me another copy?
Thanks