What is the Correlation Coefficient?
The correlation coefficient of a data set is a statistical number that tells how strongly two variables are related to each other. It can be said that it is the percentage of the relation between two variables (x and y). It can't be greater than 100% and less than -100%.
The correlation coefficient falls between -1.0 and +1.0.
A negative correlation coefficient tells us that if one variable increases, other variable decreases. A correlation of -1.0 is a perfect negative correlation. This means that if x increases by 1 unit, y decreases by 1 unit.
A positive correlation coefficient tells us that if one variable's value increases, other variable's value also increases. This means that if x increases by 1 unit, y also increases by 1 unit.
The correlation of 0 says that there is no relation between two variables what so ever.

The Mathematical formula of Correlation Coefficient is:
=Coveriancexy/(Stdx*Stdy)
Coveriancexy is the covariance (sample or population) of data set.
Stdx= It is Standard Deviation (sample or population) of Xs.
Stdy= It is Standard Deviation (sample or population) of Ys.
How to Calculate the Correlation Coefficient in Excel?
If you need to calculate the correlation in excel, you do not need to use the mathematical formula. You can use these methods
Let's see an example to know how to calculate the correlation coefficient in excel.
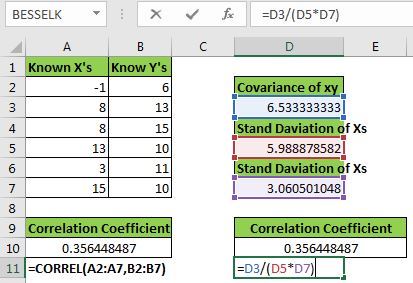
Here I have a sample data set. We have xs in range A2:A7 and ys in B2:B7.

We need to calculate the correlation coefficient of xs and ys.
Using Excel CORREL Function
Syntax of the CORREL function:
| =CORREL(array1,array2) |
array1: This is the first set of values (xs)
array2: It is the second set of values (ys).
Note: the array 1 and array 2 should be of the same size.
Let's use the CORREL function to get the correlation coefficient. Write this formula in A10.
| =CORREL(A2:A7,B2:B7) |
We get a correlation of 0.356448487 or 36% between x and y.
Using Excel Analysis Toolpak
To calculate correlation using analysis toolpak follow these steps:


 How correlation is being calculated?
To understand how we are getting this value, we need to find it manually. This will clear our doubts.
As we know the correlation coefficient is:
=Coveriancexy/(Stdx*Stdy)
First, we need to calculate the covariance. We can use the COVERIACE.S function of excel to calculate it.
| =COVARIANCE.S(A2:A7,B2:B7) |
Next, let's calculate the standard deviation of x and y using the STDEV.S function.
| =STDEV.S(A2:A7) |
| =STDEV.S(A2:A7) |
Now in cell D10, write this formula.
| =D3/(D5*D7) |
This is equivalent to =Covariancexy/(Stdx*Stdy). You can see that we get the exact same value as given by the CORREL function. Now you know how we have derived the correlation coefficient in excel.

Note: In the above example, we have used COVARIANCE.S (covariance of the sample) and STDEV.S (standard deviation of the sample). The correlation coefficient will be the same if you use COVARIANCE.P and STDEV.P. As long as they both are of the same category there will be no difference. If you use COVARIANCE.S (covariance of the sample) and STDEV.P (standard deviation of the population) then the result will be different and incorrect.
So yeah guys, this is how we can calculate correlation coefficient in excel. I hope this was explanatory enough to explain the correlation coefficient. You can now create your own correlation coefficient calculator in excel.
Related Articles:
How to Create Standard Deviation Graph
Descriptive Statistics in Microsoft Excel 2016
How to Use Excel NORMDIST Function
Popular Articles:
The applications/code on this site are distributed as is and without warranties or liability. In no event shall the owner of the copyrights, or the authors of the applications/code be liable for any loss of profit, any problems or any damage resulting from the use or evaluation of the applications/code.