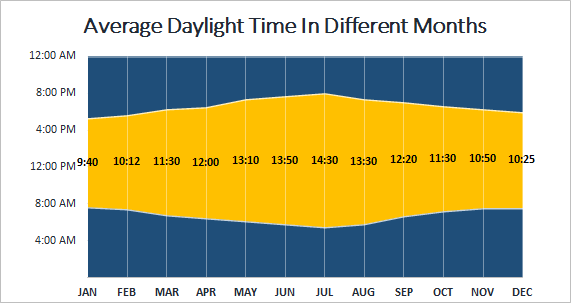
You must have seen sunrise charts on different weather sites for depicting daylight time in different months or weeks of years. Being a creative individual, you’ve just thought if you can create this Sunrise Sunset chart in excel. I did. In this article, we will learn how to create a sunrise chart in excel that shows the daylight hours.
Let’s see an example to make things clear.
Example: Creating Excel Sunrise Sunset Graph
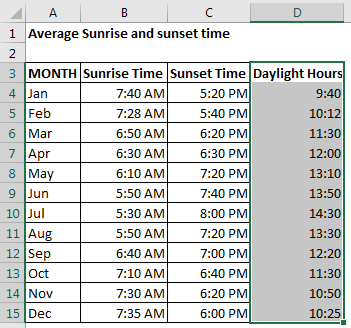
To create this chart we need sunrise time, the daylight time and the evening time. Here I have gathered the average sunrise and sunset time so that we can use them to create a sunrise chart.

Preparation of Data
So here we have sunrise time in B column and sunset time in C column. Obviously, before sunrise, it is night time, and the daylight time is between sunrise time and sunset time.
To get daylight time, we will subtract sunrise time from sunset time. This will be daylight hours.
Daylight hours = Sunset time - Sunrise Time
Using the above formula, we write this in D4 and copy it down the cells.
Now to calculate evening hours, we will subtract sunset time from 1. In excel, in terms of time, 1 means a day (24 hours). So if we subtract the sunset time from 1 the remaining time is evening hours.
Evening hours = 1- Sunset time
Using the above formula in write this formula in E4 and drag it down.
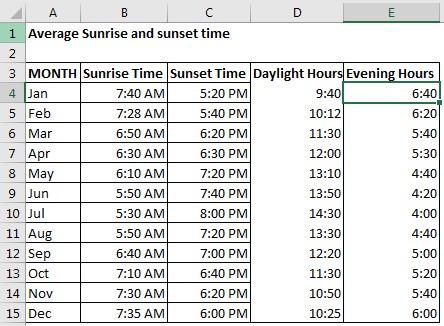 Now we have our data ready. Now we have our time table of sunrise, daylight and evening hours is ready, let’s head to creating the damn graph.
Creating a sunrise-sunset graph
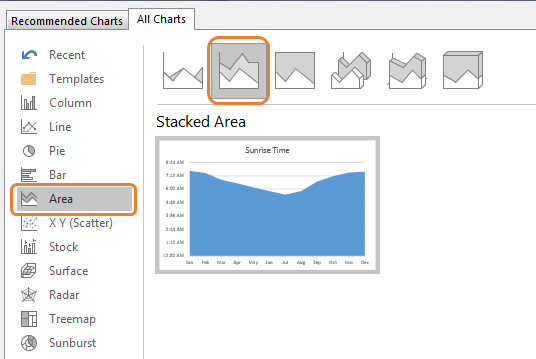
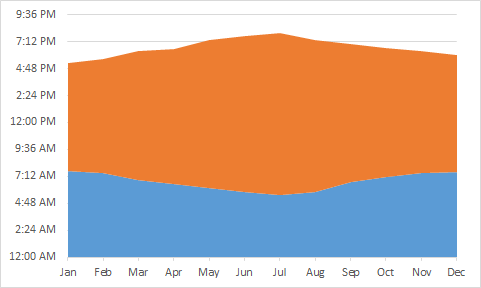
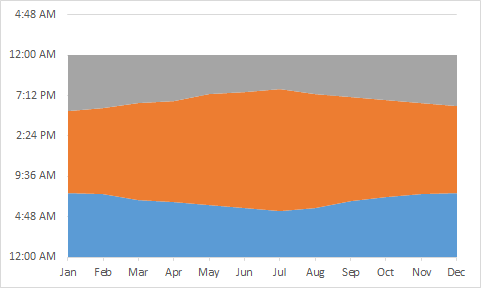
The Sunrise chart is ready but it doesn’t look that great. Let’s make it a little bit more readable and eye-catching.
Formatting the Sunrise Chart

Now the chart looks like this.
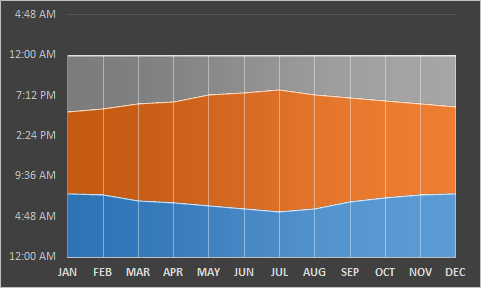

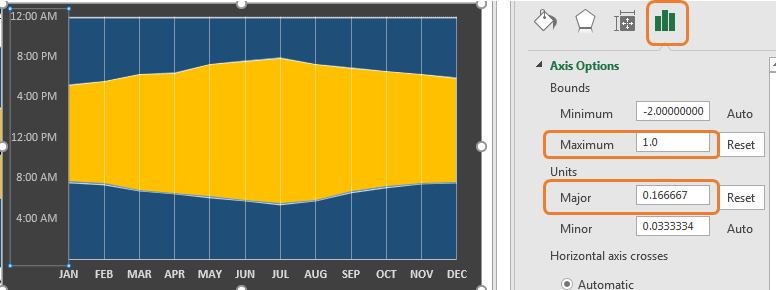
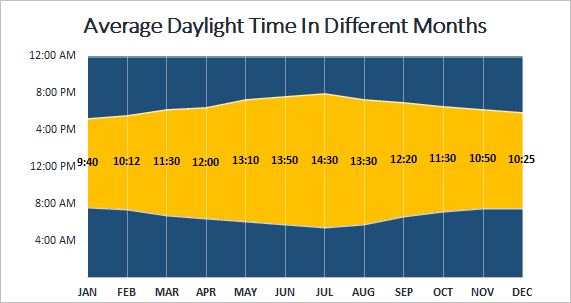
The sunrise and sunset chart is ready. The time shown in the orange area is the average hours of daylight in that month.
So yeah guys, this how you can make a sunrise sunset chart in excel. This is quite easy if you know the basics of charts in excel. I have used excel 2016 in this example but this can be made in excel 2007 to 2019. Let me know if you have any doubts regarding this article or any other excel topic of advanced excel or VBA.
Download file:
Related Articles:
Excel Sparklines : The Tiny Charts in Cell
Speedometer (Gauge) Chart in Excel 2016
Creative Column Chart that Includes Totals
4 Creative Target Vs Achievement Charts in Excel
Popular Articles:
The applications/code on this site are distributed as is and without warranties or liability. In no event shall the owner of the copyrights, or the authors of the applications/code be liable for any loss of profit, any problems or any damage resulting from the use or evaluation of the applications/code.