In this article, you will learn on to show Indian Rupee symbol in chart.
Let us take an example to understand:
We have Sales Report that contains US states & quarterly sales.

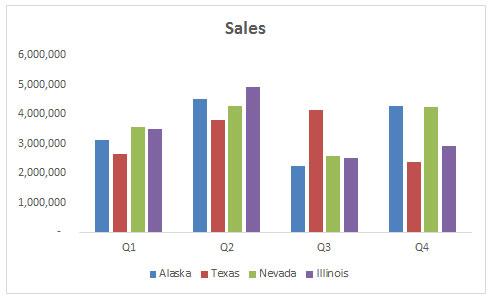
From the above data, we have made a chart to show the quarterly Sales for each state.

Here, we want to show the sales in millions with Indian Rupee symbol.
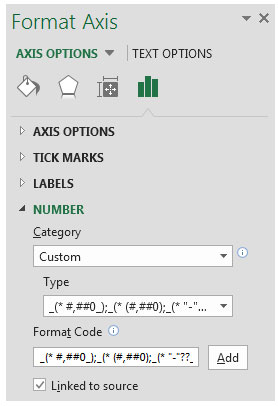
Right click on Vertical Value Axis & click on Format Axis

The Format Axis options will be displayed

Select Number option

Select the Category as Custom; in Format Code, paste the following code
[>999999]?#,," M";[>999]?#,"K";?#

Click on Add. This will show the Indian Rupee symbol in the chart. Refer below shown snapshot

In this way, you can show Indian Rupee symbol in the chart.
The applications/code on this site are distributed as is and without warranties or liability. In no event shall the owner of the copyrights, or the authors of the applications/code be liable for any loss of profit, any problems or any damage resulting from the use or evaluation of the applications/code.