In this article, we will learn how we can prepare a Pie chart in Microsoft Excel 2010.
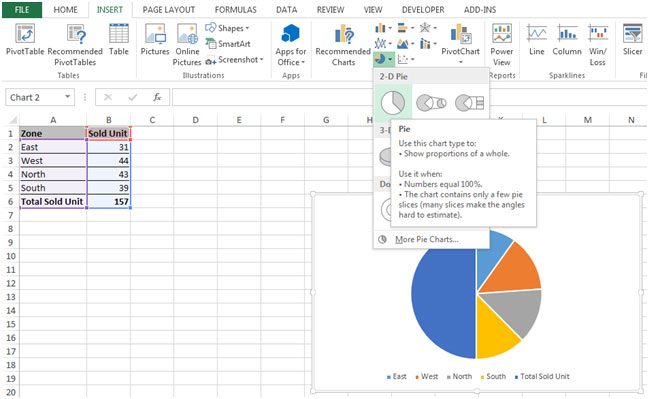
Pie Chart: - This chart is used to show the proportion of the whole. Use it when numbers are equal to 100% and the chart contains only few pie slices (many slices make the angels hard to estimate).
This pie chart contains the three type of charts in which 1st is 2D Pie Chart , 2nd is 3D Pie chart and 3rd is Doughnut Pie chart.

Let’s take an example &understand.
We have a table from Range “A6 to B11”, which is having Zone & Sold unit with total sold unit. Column A contains the Zone Name, Column B Sold, & cell B11 is having total sold unit. We have another table of Targets & Require sold unit per zone.

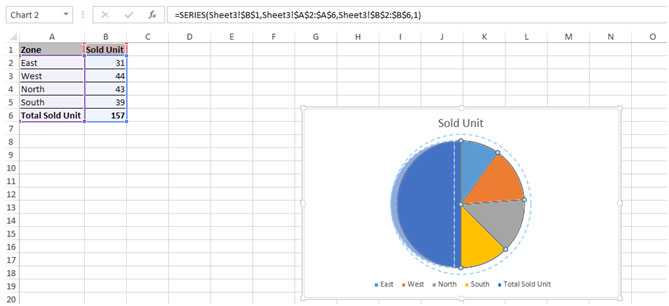
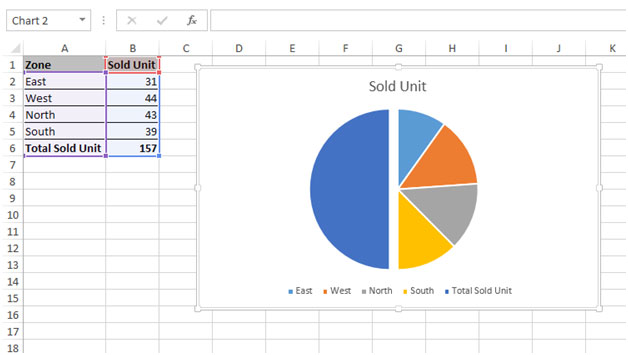
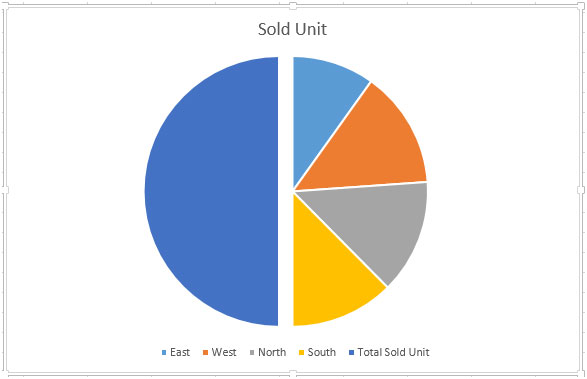
To prepare the Pie chart, follow below mentioned steps:-

Move the Chart:-


Resize the Chart:-


Add labels to the Chart:-


To Delete the legend, follow the below mentioned steps:


Note:- If you having the option of choosing a different chart type then, consider making a Bar chart or Column chart instead of Pie chart. You can use these charts as alternative as they are easier to compare the values.
The applications/code on this site are distributed as is and without warranties or liability. In no event shall the owner of the copyrights, or the authors of the applications/code be liable for any loss of profit, any problems or any damage resulting from the use or evaluation of the applications/code.