The pivot charts are the charts which are based on pivot reports. And same as pivot tables the pivot charts does not update any changes made in source data until they are refreshed.

To update a chart, just Right Click on the pivot chart and click on Refresh. This is the easiest way to refresh a pivot table or chart.
To illustrate this let’s create a pivot chart in excel.
Example: Create Pivot Chart and Update It.
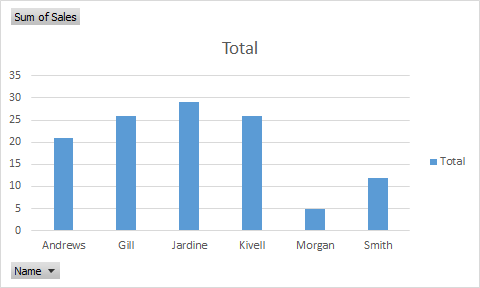
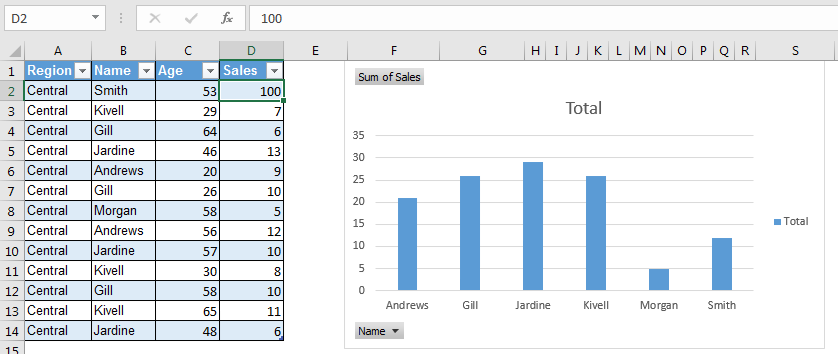
Here I have a excel table that consists sales data of employees. Now let’s summarize it in a pivot chart.
Select any cell in data and go to Insert? Pivot Charts (not pivot tables). Insert it on the same sheet.

In Axis, put names and in Values put sales. Aur pivot chart is ready.

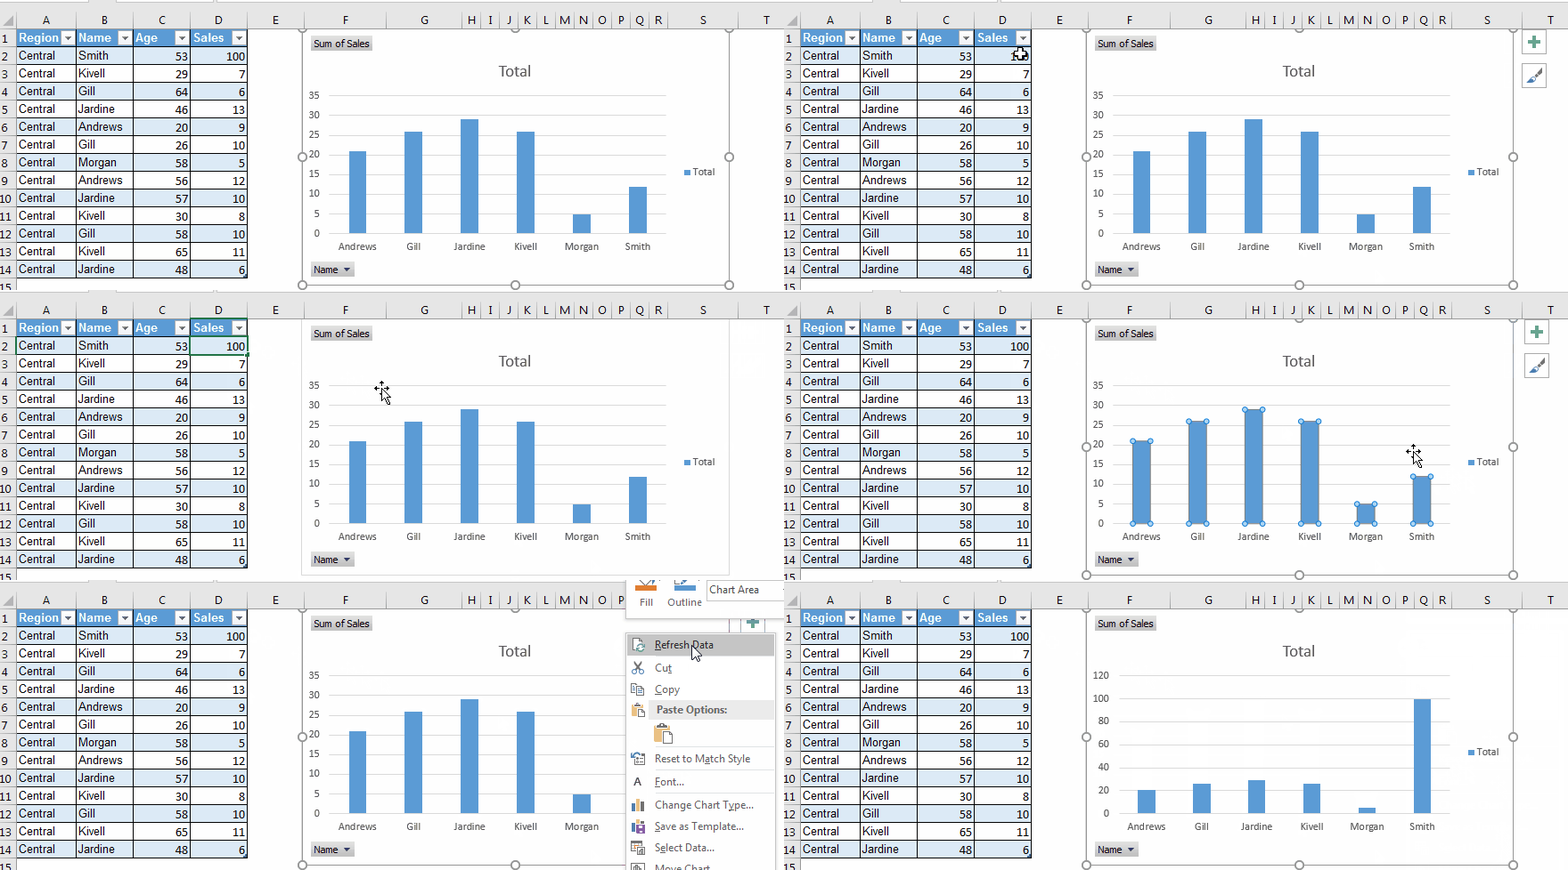
Now let’s just alter some data in source table. Add 100 sales to Smith.
You can see that nothing changes in the pivot chart.

Now to reflect that change in the pivot chart, right-click on pivot chart and click on refresh. Now you can see the changes in the chart that you have made in source data.
How does it work?
Actually pivot tables and charts store a cache of data. Until we clear the old one, the pivot chart will show the old report. Once we refresh the chart, the cache is cleared and new data is stored as cache.
So yeah guys, this how you refresh a pivot chart in excel. Let me know if you have any doubts regarding this article or any other topic of excel and VBA. The comments section is open.
Related Articles:
Show hide field header in pivot table
Popular Articles:
The applications/code on this site are distributed as is and without warranties or liability. In no event shall the owner of the copyrights, or the authors of the applications/code be liable for any loss of profit, any problems or any damage resulting from the use or evaluation of the applications/code.